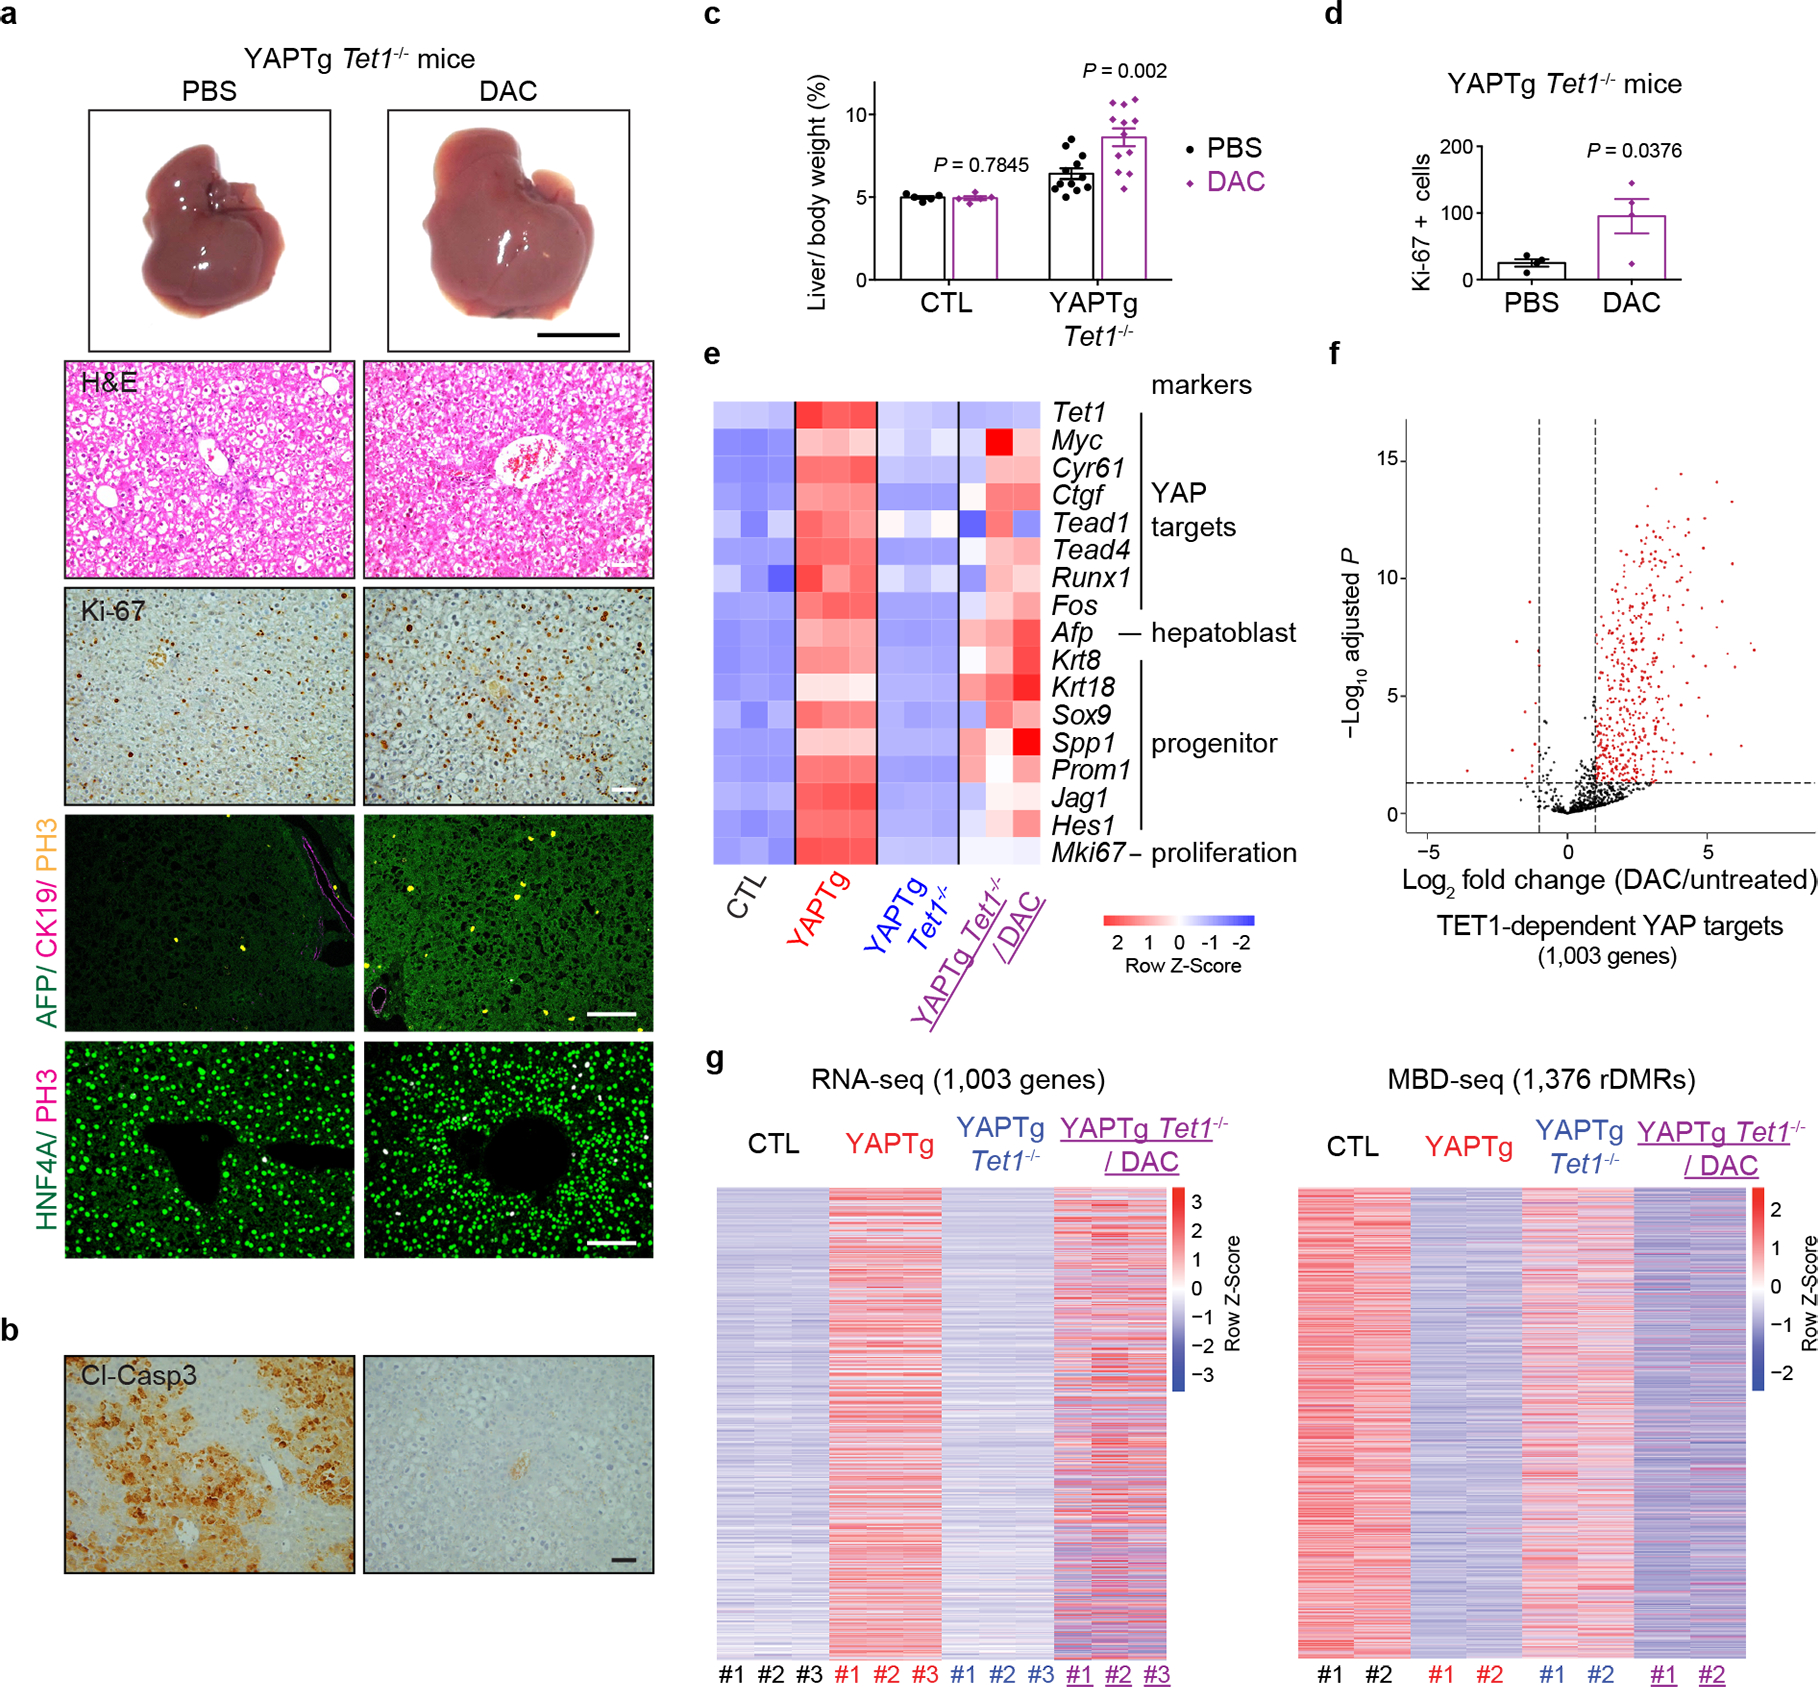
Fig. 7 |. Drug-induced DNA demethylation partially compensates for TET1 function in YAPTg Tet1−/− livers.

a, Representative gross image, H&E staining and immunostaining of livers from PBS-treated (n = 12) and DAC-treated (n = 12) YAPTg Tet1−/− mice. 1-month-old mice were kept on 50 mg/l Dox, injected intraperitoneally with 0.5 mg/kg DAC daily for 10 days. Black scale bar, 1 cm. White scale bar, 100 μm. b, Representative cleaved caspase-3 (Cl-casp3) staining of liver sections from PBS-treated (n = 4) and DAC-treated (n = 7) YAPTg Tet1−/− mice. 1-month-old mice were kept on 50 mg/l Dox, injected intraperitoneally with 0.5 mg/kg DAC daily for 10 days. Mice were then injected with Jo-2 antibody to induce liver injury and analyzed 5 hours post injection. Scale bar, 100 μm. c, Quantification of liver-to-body weight ratio from control (PBS-treated n = 5; DAC-treated n = 5) and YAPTg Tet1−/− mice (PBS-treated n = 12; DAC-treated n = 12). d, Quantification of Ki-67 positive cells in livers from PBS-treated and DAC-treated YAPTg Tet1−/− mice (n = 4). e, Heatmap of RNA-seq data displaying expression of representative hepatic lineage markers between the indicated mice. f, A volcano plot for differential RNA expression of 1,003 TET1-dependent YAP target genes in DAC-treated compared to untreated YAPTg Tet1−/− livers. Red dots represent remarkable (fold change ≥ 2) and significant (P < 0.05) genes. g, Heatmaps of RNA-seq (left panel) and MBD-seq (right panel) data displaying changes of 1,003 TET1-dependent YAP target genes between the indicated mice. Values represent mean ± s.e.m. (c, d). P values are calculated with unpaired two-tailed Student’s t-test (c, d).
