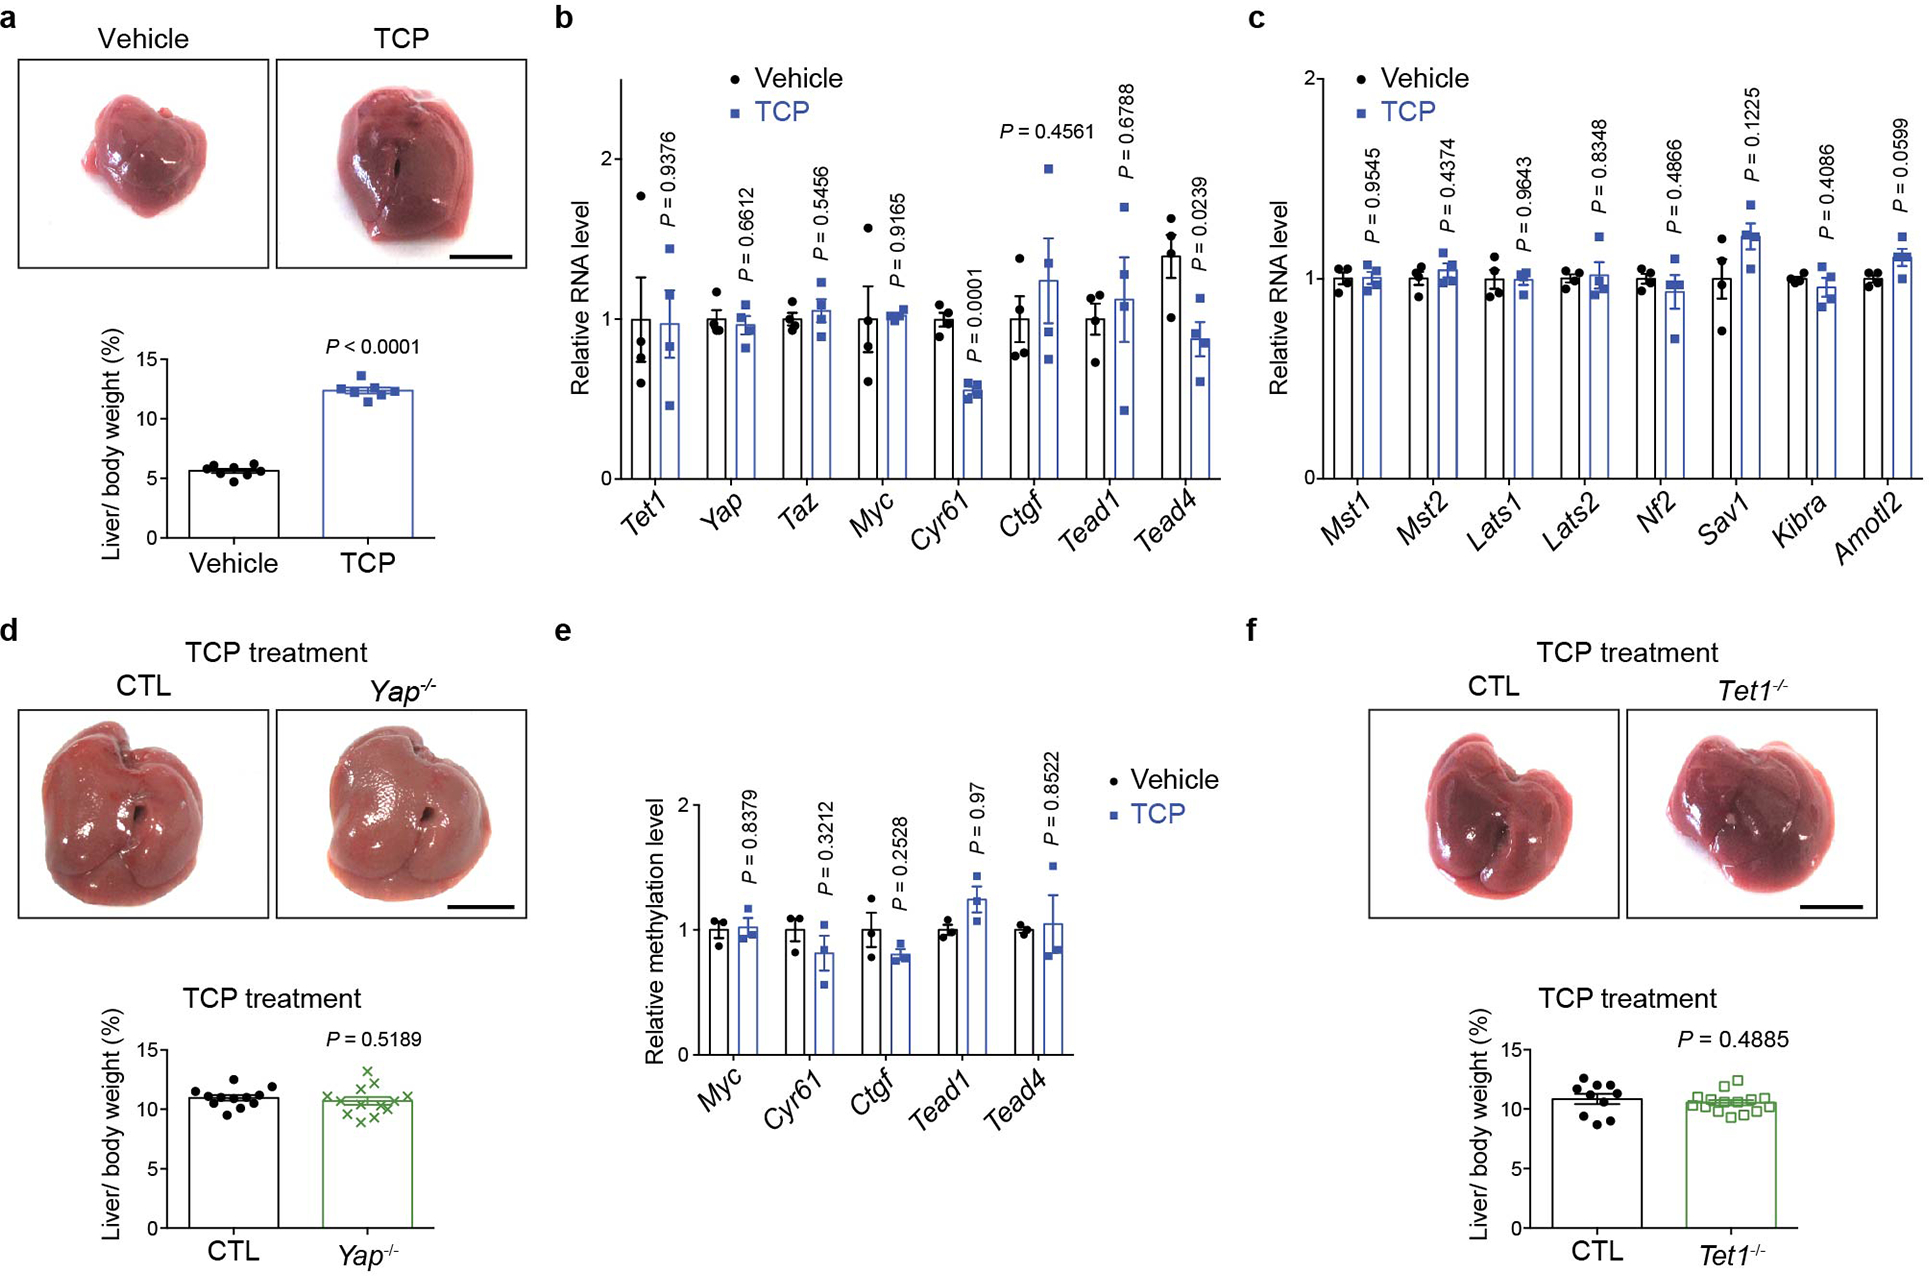
Extended Data Fig. 2. YAP and TET1 are dispensable for TCP-induced hepatomegaly.

a, Representative gross image of livers (top panel) and quantification of liver-to-body weight ratio (bottom panel) from vehicle-treated (n = 8) and TCP-treated (n = 7) mice. 1-month-old mice were injected intraperitoneally with a single dose of 3 mg/kg TCP. Mice were sacrificed 7 days post injection. b, c, RT-qPCR showing mRNA levels of the YAP downstream target genes (b) or upstream suppressor genes (c) in TCP-treated livers. mRNA levels were normalized to vehicle-treated control livers (n = 4). d, Representative gross image of livers (top panel) and quantification of liver-to-body weight ratio (bottom panel) from 1-month-old Yap mutant mice (CTL n = 12; Yap−/− n = 13) subjected to TCP-induced hepatomegaly. e, MBD-qPCR of methylation levels at the indicated rDMRs in TCP-treated mouse livers. Methylation levels were normalized to vehicle-treated control livers (n = 3). f, Representative gross image of livers (top panel) and quantification of liver-to-body weight ratio (bottom panel) from 1-month-old Tet1 mutant mice (CTL n = 10; Tet1−/− n = 15) subjected to TCP-induced hepatomegaly. Values represent mean ± s.e.m. (a, b, c, d, e, f). P values are calculated with unpaired two-tailed Student’s t-test (a, b, c, d, e, f).
