Figure 3.
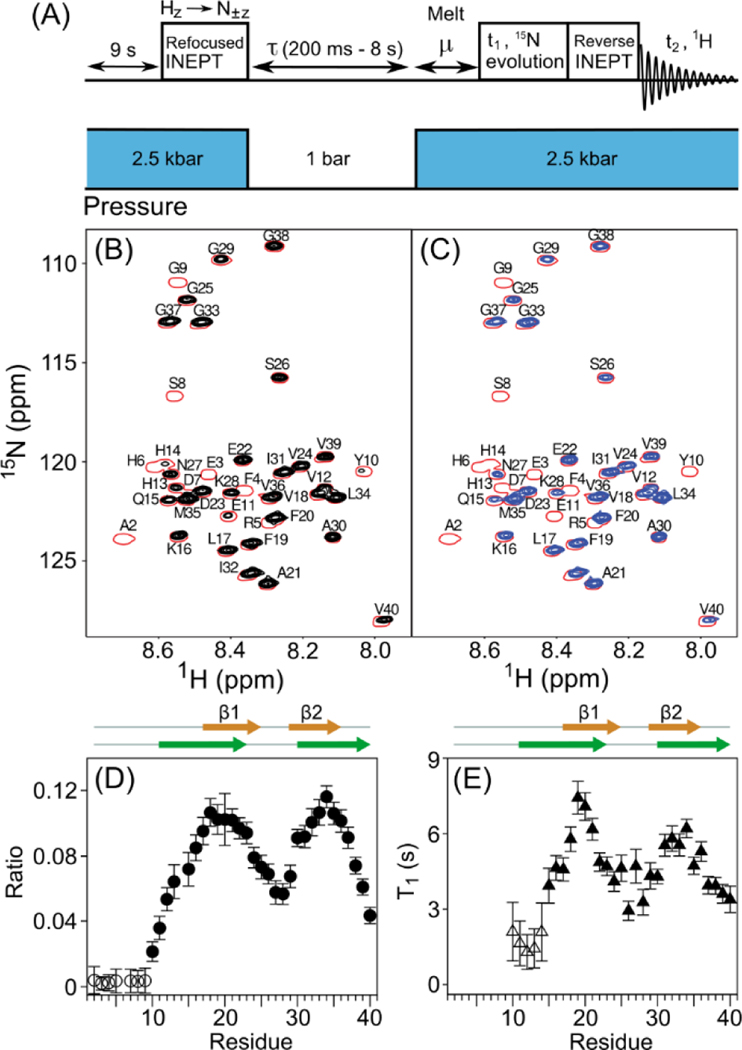
Observation of Aβ40 1H-15N HSQC signals during a T1-filtered pressure-jump NMR experiment. (A) Schematic timing diagram; see SI for details. Strong, non-equilibrium 15N z magnetization is generated by a refocused INEPT transfer28 just prior to dropping the pressure. After a variable low-pressure delay (0.2–8 s) and a 350-ms “melting” interval, μ, at high pressure, 15N t1 evolution and 1H detection are used to generate conventional 15N-1H HSQC spectra. (B) Overlays of spectra recorded with a 0.2 s low-pressure duration (single red contour), and resonances that remain after a 5.5-s low-pressure interval (black contours). (C) Overlay of the spectra recorded with 0.2-s (red) and 8-s (blue) low-pressure intervals. (D) Intensity ratios observed in (B) vs. Residue number. Open symbols correspond to an upper limit for the non-observed intensity. (E) 15N longitudinal relaxation time (T1) in the oligomeric state, derived from the intensity ratio of resonances observed with 5.5-s and 8-s low pressure durations. β-strand positions are from Hoyer et al.25 (orange) and Paravastu et al.3 (green).

