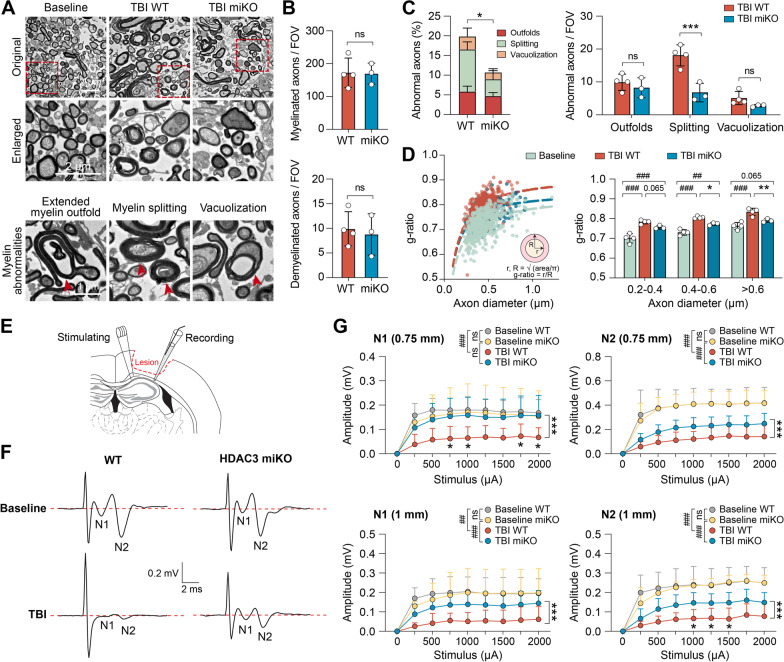
Fig. 6.
HDAC3 miKO improves nerve signal conduction in the white matter after TBI. A–D White matter ultrastructure was examined in the ipsilesional CC 42 days after TBI using transmission electron microscopy (TEM). A Representative TEM images. TBI induced demyelination and abnormal myelin morphology in myelinated axons (lower panel), such as extended myelin outfold, myelin splitting, and vacuolization (arrow). B, C The numbers of myelinated axons, demyelinated axons, and myelinated axons with abnormal myelin morphology were counted in post-TBI HDAC3 miKO mice and control WT mice. Data were expressed as the number of axons per field of view (FOV; 200 μm2) or percentage of total myelinated axons. D Scatter plot (left panel) and summarized data (right panel) showing the g-ratio of all axons counted from 3 to 4 mice in each group. Baseline control group was pooled from both WT and HDAC3 miKO mice. E–G Axonal conduction at the ipsilesional CC/external capsule was assessed 42 days after TBI by measuring the evoked compound action potentials (CAPs). E Diagram showing the location of the stimulating and recording electrodes at the external capsule. Dashed line: the boundary of the lesion. F Representative traces of the evoked CAPs at 2000 µA stimulation to show the N1 (through myelinated axons) and N2 (through unmyelinated axons) components, recorded 1 mm from the stimulation point. G Quantification of the N1 and N2 amplitudes after various stimulation current intensities, recorded 0.75 mm and 1 mm from the stimulating point. n = 5–8 mice per group. Shown are the mean ± SD. ##p < 0.01, ###p < 0.001 TBI vs. baseline. *p < 0.05, ***p < 0.001 HDAC3 miKO vs. WT after TBI. ns no significant difference

