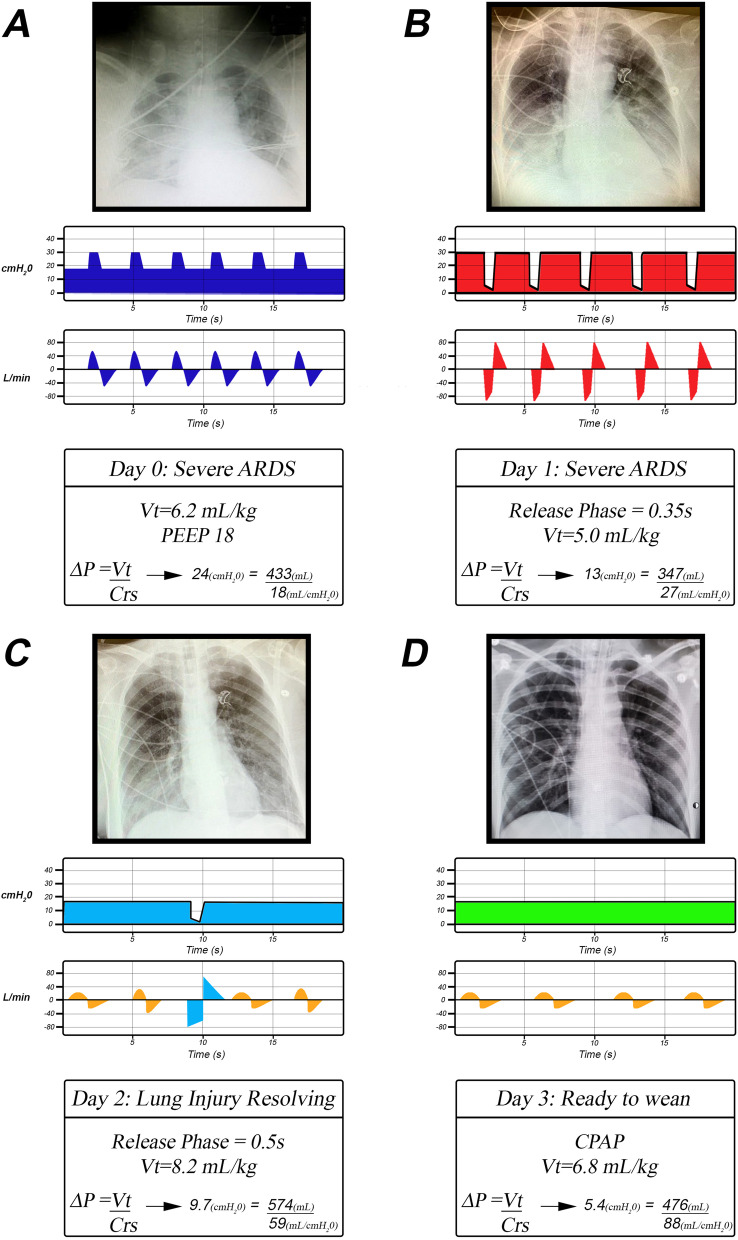
Fig. 5.
A representative illustration of the sequence of events typically seen during the progressive ‘Unshrinking the Baby Lung’ using the TCAV method to set and adjust the APRV mode. Using this method, the lung is first stabilized using a brief expiratory duration (B) and then gradually recruits collapsed lung tissue over hours or days using an extended inspiratory duration (B). A Patient with severe ARDS with extensive lung collapse and edema (X-ray) ventilated using the ARDSNet low VT method showing typical Pressure/Time and Flow/Time curves (blue) as seen on a ventilator monitor. Even with a low VT (6.2 mL kg−1), the driving pressure (ΔP) is elevated (24 cmH2O) because the CRS is very low (18 mL/cmH2O). B The first day after the patient has been switched to the TCAV method, and the lung has begun to reopen showing typical Pressure/Time and Flow/Time curves as seen on a ventilator monitor (red). Although the lung has partially opened, it is still unstable and would rapidly re-collapse at lower airway pressures or if expiratory time was greater than the 0.35 s Release Phase. The CRS has improved (27 mL cmH2O−1) because of the recruited lung tissue (X-ray). Nevertheless, the CRS is low and lung recoil remains high, so the Release Phase is brief. The brief Release Phase generates a small VT (5.0 mL kg−1), which maintains the ΔP (13 cmH2O) within the safe range. At this time, there are no spontaneous breathing efforts. C On Day 2, the lung is nearing full recruitment, as evidenced by a markedly improved chest X-ray. The patient is breathing spontaneously (Flow/Time curve gold waves) and is contributing to the total minute ventilation (MVe). Although the TLow is still set to 75%, the release time is now 0.5 s and VT have increased (8.2 mL kg−1) with a more fully recruited lung. The ΔP has decreased to 9.7 cmH2O, even with a VT of 8.2 mL kg−1 because of an increase in CRS (59 mL cmH2O−1). Only an occasional Release Phase is needed to facilitate CO2 removal (Flow/Time curve light blue wave), since most of the MVe is generated by the patient’s spontaneous breathing (Flow/Time curve gold waves). Spontaneous VT average 6.0 mL kg. D On Day 3, the patient is ready to be weaned with restored lung volume. The Release Phase has been eliminated and the patient is generating all of their MVe with spontaneous breathing (Flow/Time curve gold waves). As a result, VT has increased further (6.8 mL kg−1), and ΔP (5.4 cmH2O) and CRS (88 mL cmH2O−1) are within their normal ranges. Note that a VT greater than 6 mL kg−1 is not harmful (i.e., normal ΔP) when delivered into a fully inflated lung with high CRS [10]. Also, note VT remains proportional to CRS. VT = tidal volume, PEEP = positive end-expiratory pressure, CRS = respiratory system compliance, MVe = minute ventilation, and ΔP = Driving Pressure (VT/CRS).

