
Figure 3. Optogenetic Induction of BRA Expression Is Light Dose Dependent.
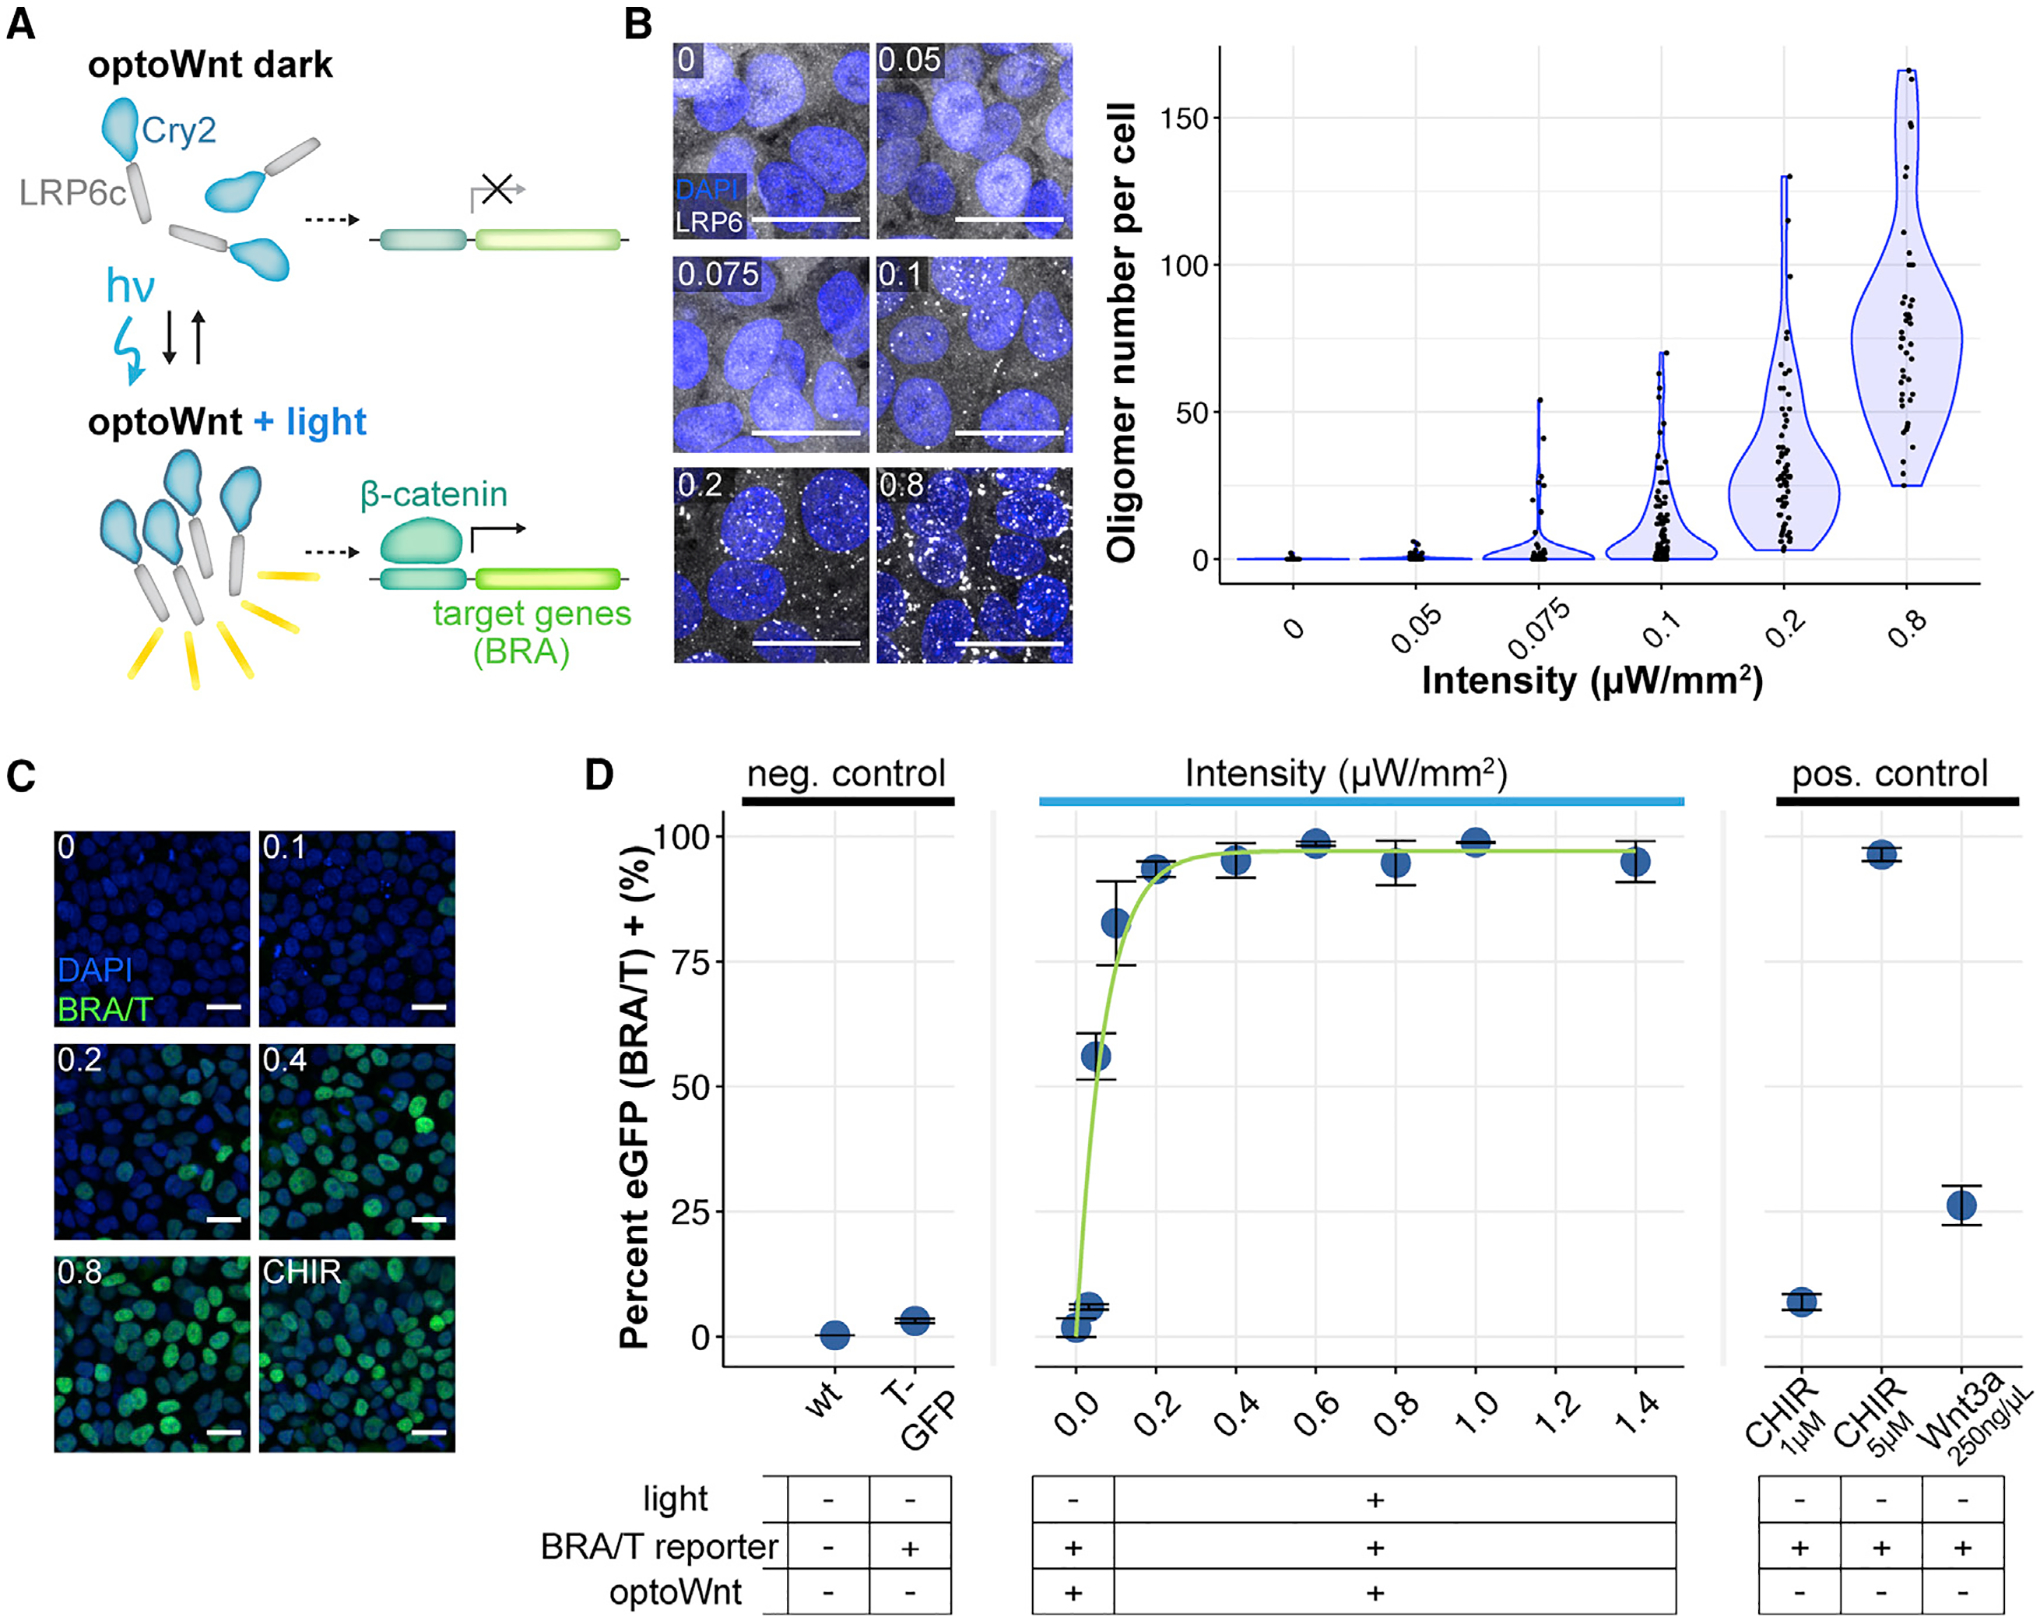
(A) Schematic of optoWnt system. In the dark, the Cry2 photosensory domain is diffuse. Illumination induces LRP6c oligomerization and the transcription of β-catenin target genes.
(B) Immunostaining for LRP6 (left) and quantification of cluster number per hESC in response to increasing light intensity after 1-h illumination. The graph shows individual cell quantification, with each point representing a single cell. Scale bar, 25 μm.
(C) Immunostaining for BRA in response to increasing light intensity after 24 h illumination or 3 μM CHIR treatment. Scale bar, 25 μm.
(D) Flow cytometry of optoWnt hESCs expressing EGFP reporter for BRA/T treated with varying light intensities or with Wnt pathway agonists (Wnt3a recombinant protein or CHIR). The graph shows the percentage of EGFP+ cells and nonlinear least-squares fit to increasing exponential decay curve. A subset of the data is reproduced from Repina et al. (2019). Graph shows means ± 1 SDs, n = 3 biological replicates.