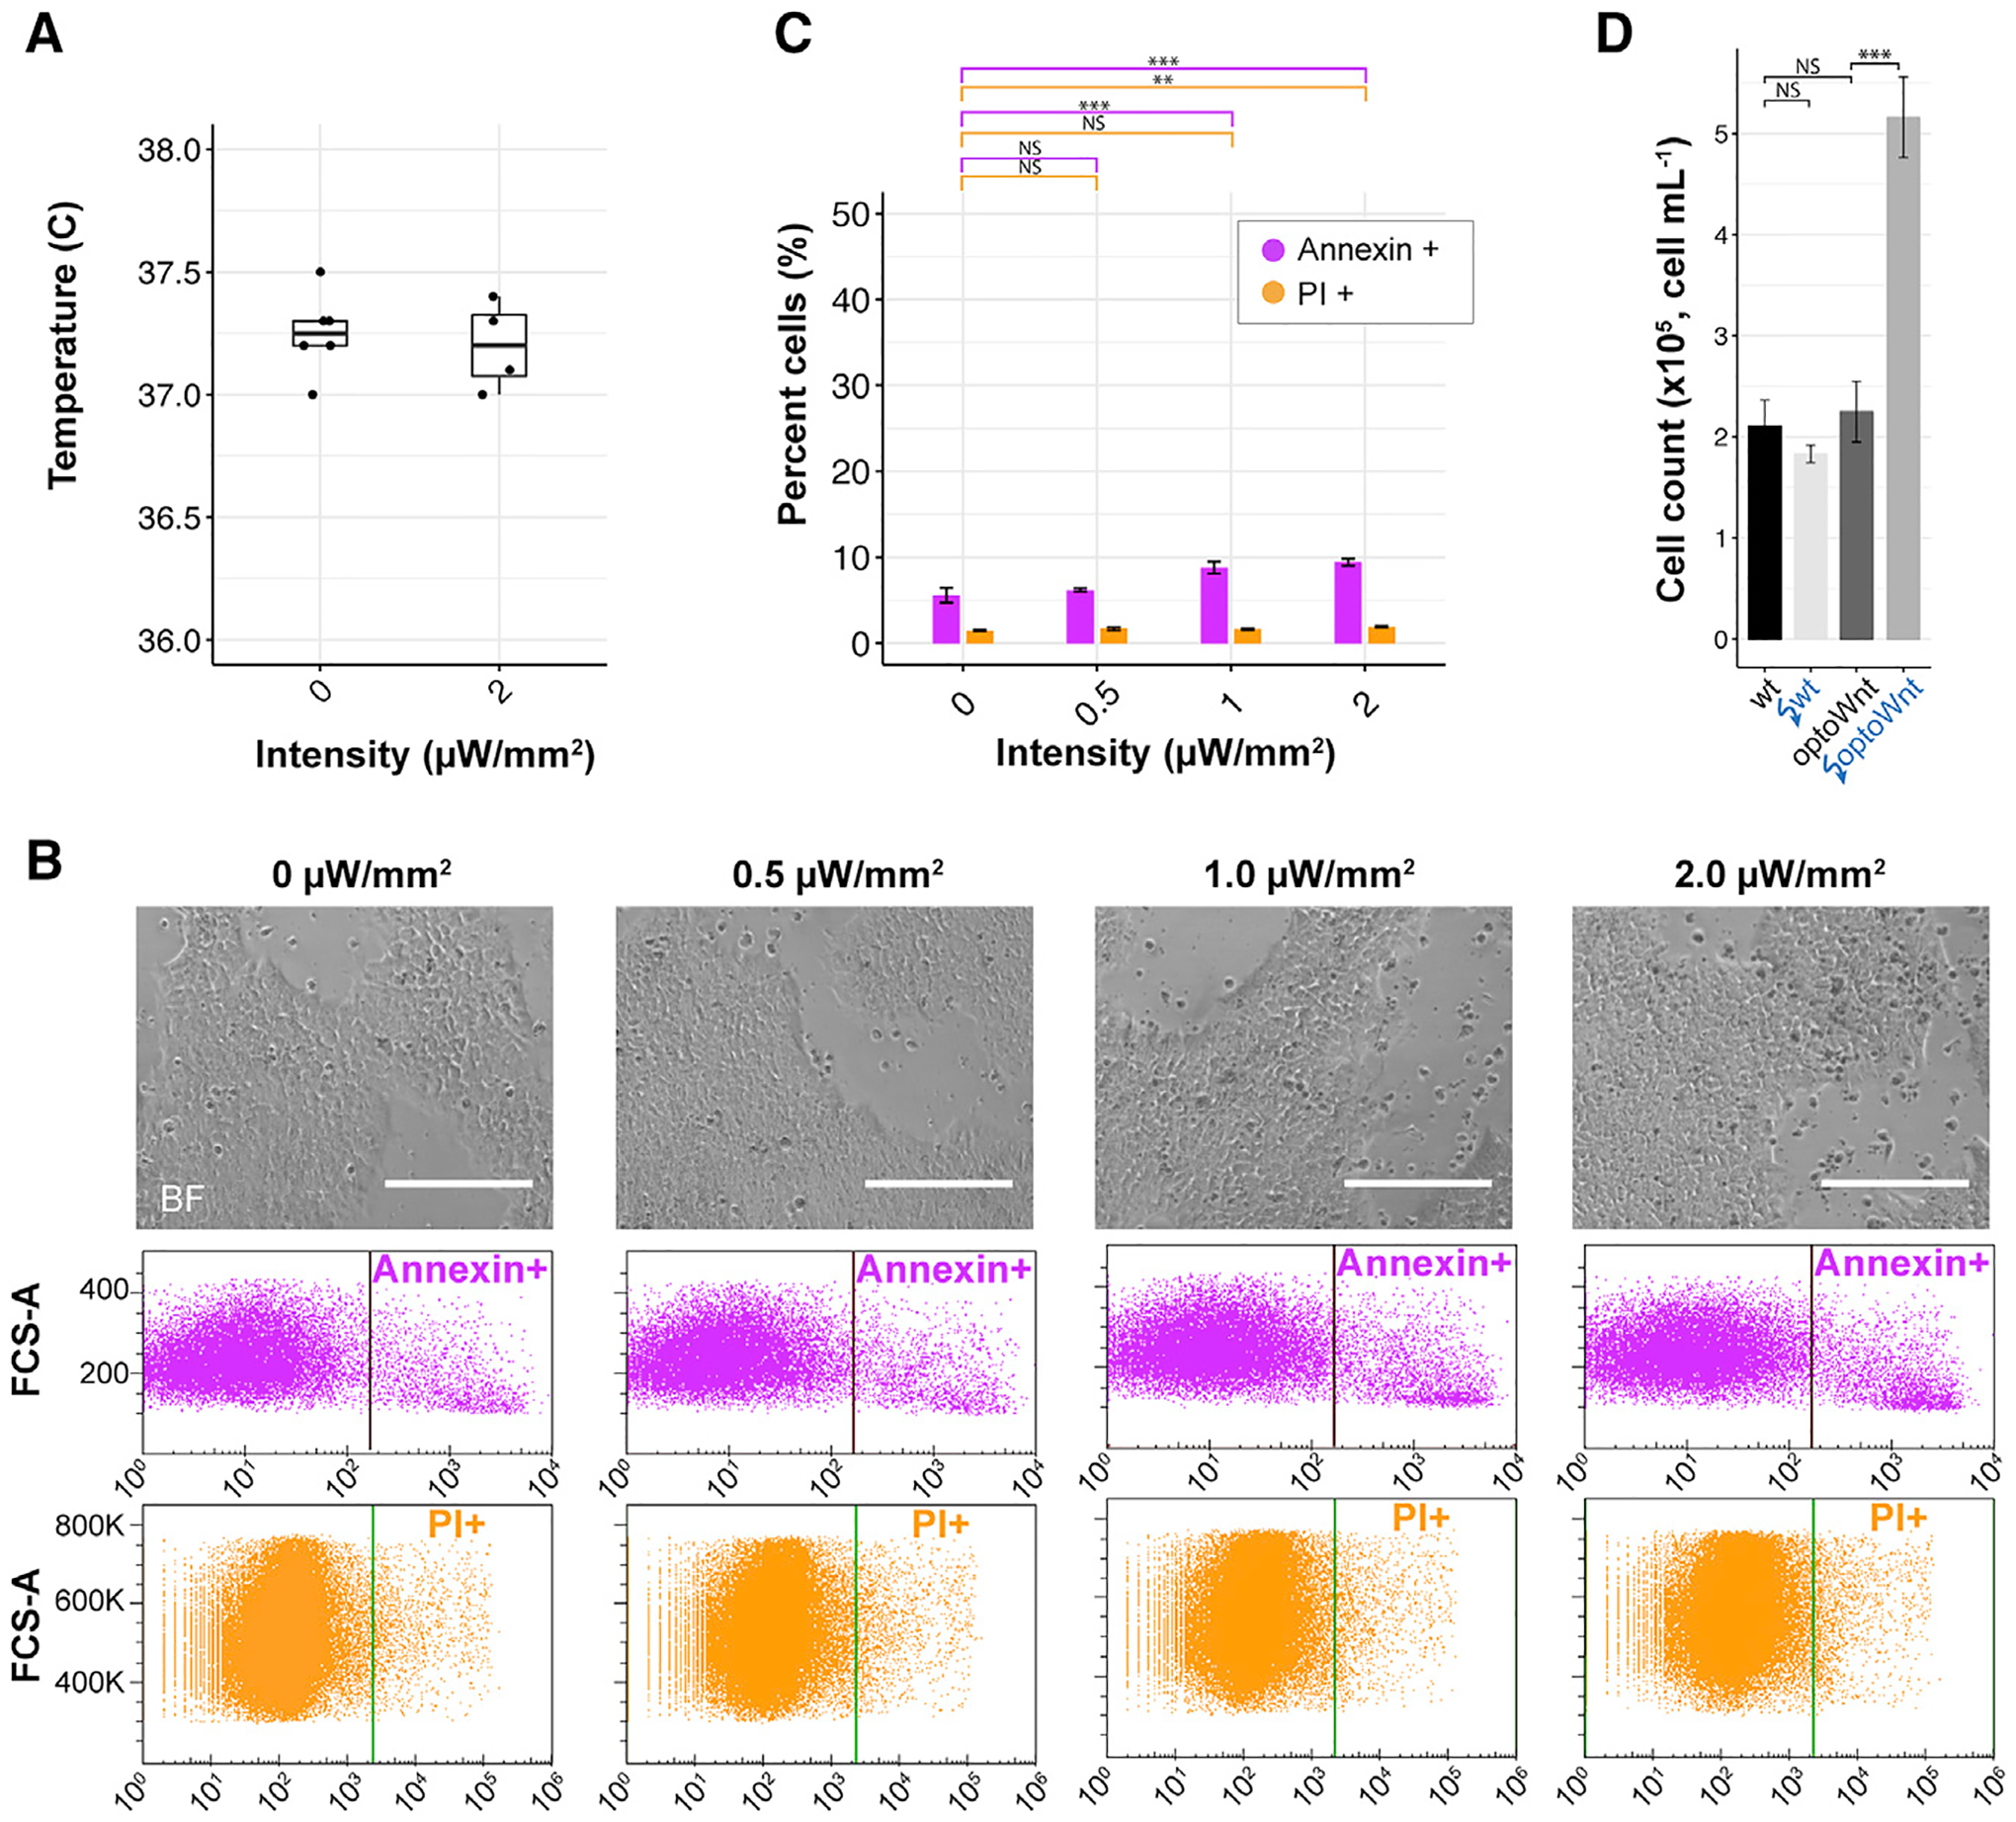
Figure 4. Low Phototoxicity during Continuous Optogenetic Stimulation of hESC Cultures.

(A) Temperature of media after 24 h of continuous illumination at indicated light intensities. Each point represents the measurement from a single well.
(B) Bright-field images (top) of live wild-type hESC cultures illuminated at indicated light intensities after 48 h. Flow cytometry results (bottom) for Annexin V and propidium iodide (PI) stain of hESCs following 48 h of illumination. Positive gating indicated by vertical line. Scale bar, 250 μm.
(C) Quantification of Annexin V and PI shows a significant increase in apoptosis and cell death >1 μW/mm2 illumination intensity (pA = 0.0008, pPI = 0.39 at 0 versus 1 μW/mm2; pA = 0.0002, pPI = 0.009 at 0 versus 2 μW/mm2). No difference was observed between 0 and 0.5 μW/mm2 (pA = 0.61, pPI = 0.18). ANOVA followed by Tukey test. The graph shows means ± 1 SDs, n = 3 biological replicates.
(D) Endpoint cell count of wild-type and optoWnt hESCs after 48 h of continuous illumination at 0 or 0.8 μW/mm2. The graph shows means ± 1 SDs, n = 3 replicates. ANOVA followed by Tukey test.
