
Figure 6. Spatial Light Patterning with LAVA Devices for Localized OptoWnt Activation.
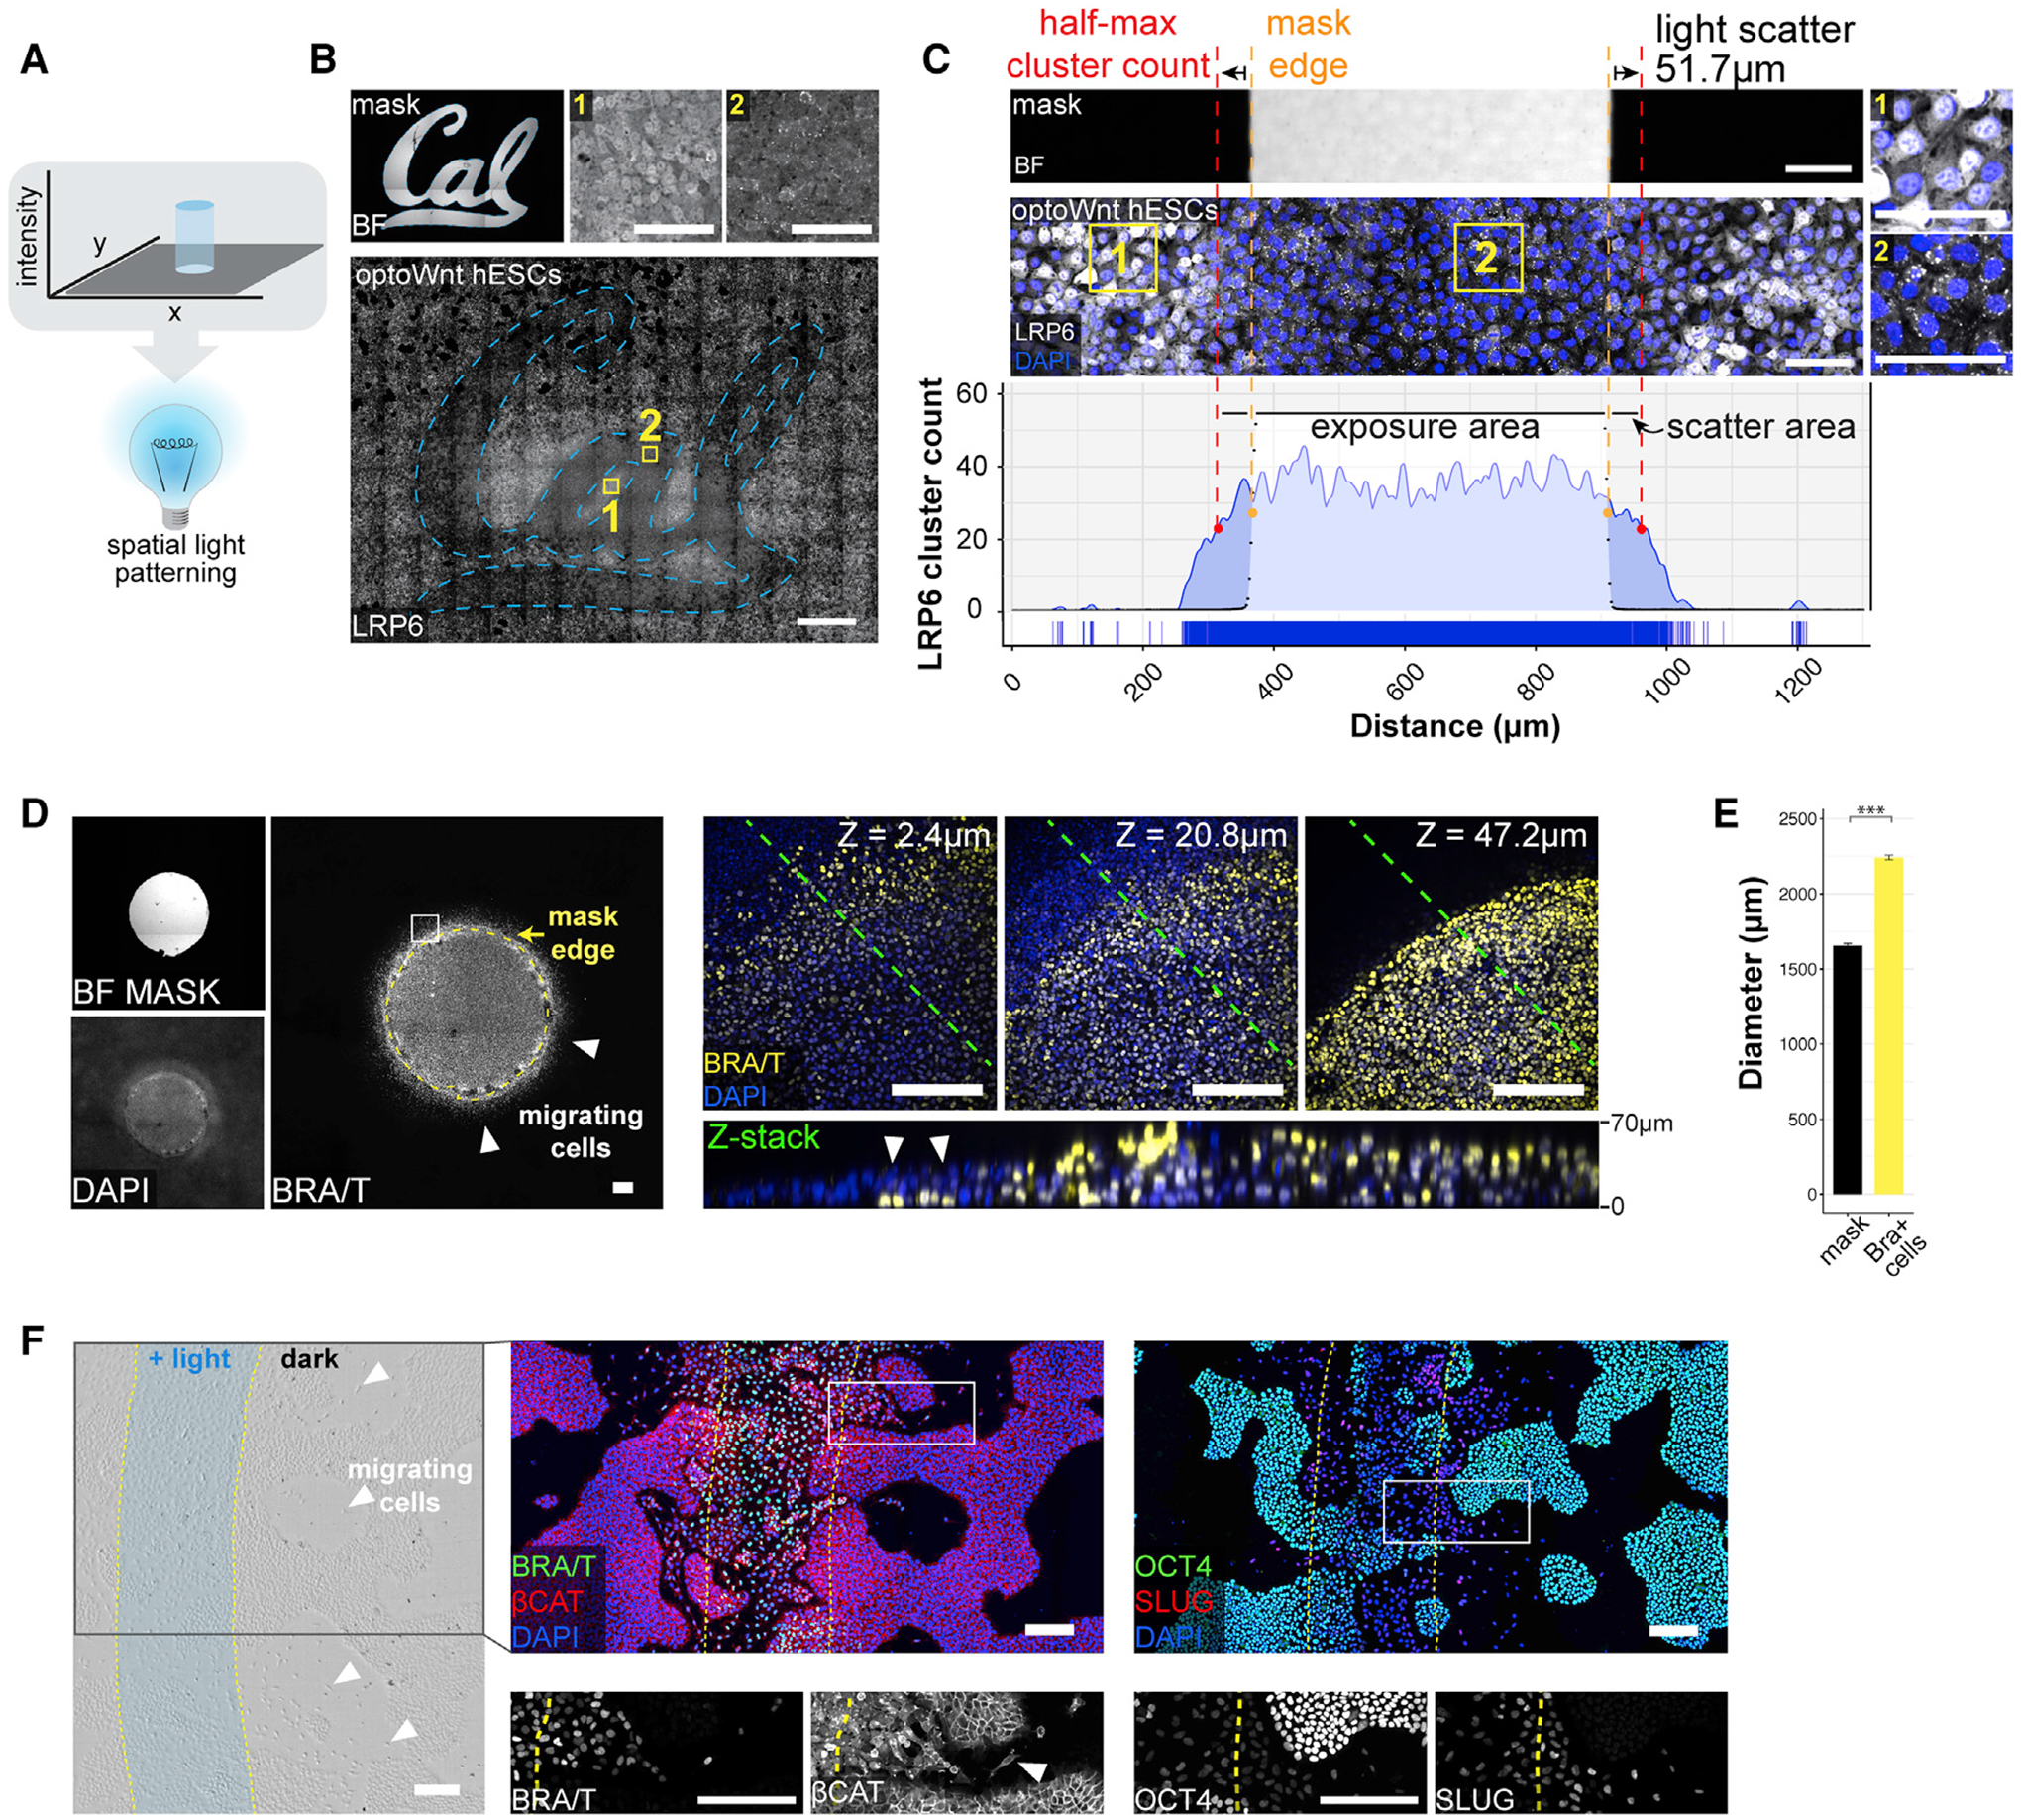
(A) Schematic of spatial light patterning in optogenetic experiments.
(B) Stitched bright-field and fluorescence confocal images of optoWnt hESCs illuminated with University of California, Berkeley (Cal) logo photomask. Immunostaining for LRP6 oligomers, with representative image of masked region (1) and illuminated region (2), as shown. Scale bar, 100 μm (top) and 1 mm (bottom).
(C) Quantification of light scattering through the bottom of a TC plate shows a ~50-μm spread (full width at half-maximal, red line) of optoWnt oligomers beyond photomask edge (orange line). Bright-field image of a photomask (top), fluorescence image of immunostaining for LRP6 (center), and quantification of LRP6 cluster count (bottom). Insets (1) and (2) show masked and illuminated regions, respectively. Scale bars, 100 μm.
(D) Patterned illumination with a 1.5-mm diameter circle of light. BRA immunostaining with photomask overlay shown in the left panel. Confocal z stacks of bottom (closest to coverslip, z = 2.4 μm), center (z = 20.8 μm), and top (z = 47.2 μm) cell layers show BRA+ cells localized beyond the photomask boundary and under the epithelial cell layer (white arrows). The bottom panel shows z slice through the cross-section highlighted with a green line. Scale bars, 100 μm.
(E) Quantification of BRA+ cell localization beyond the photomask edge. The mean diameter of the circular photomask pattern was quantified using the bright-field image channel, and the mean diameter of the BRA+ cell pattern was quantified through immunostaining, as shown in (D). The graph shows mean measured diameters ± 1 SDs, n = 3 biological replicates. Student’s t test (2-tailed). Scale bars, 200 μm.
(F) Patterned illumination with stripe of light, 500 μm in width. Bright-field image (left panel) with overlay of light pattern shows cells with mesenchymal morphology localized beyond the region of illumination (white arrows). Immunostaining for BRA and β-CAT (center panel), and OCT4 and SLUG (right panel). Overlay of light pattern is highlighted in yellow, and magnification (white box) shown below. Scale bars, 200 μm.