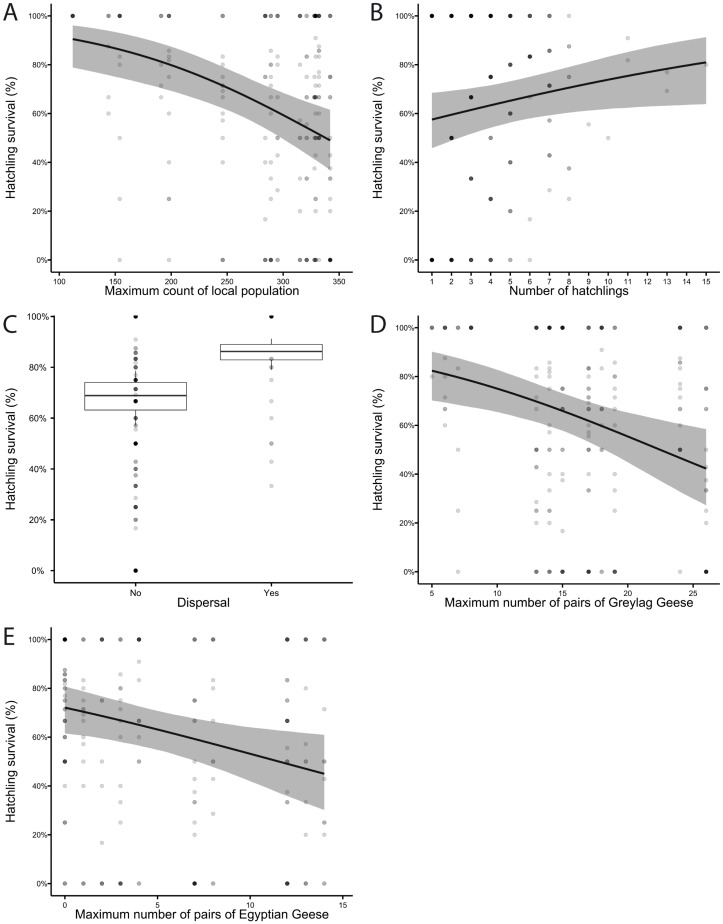
Figure 4. The probability of a hatchling to fledge (hatchling survival (%)) (A) decreased with the maximum annual count of the local population and (B) increased with the number of hatchlings per pair. (C) Dispersed pairs (n = 30) had a higher hatchling survival than pairs that did not (n = 207). Hatchling survival (%) was negatively affected by (D) the number of Greylag Geese breeding pairs and (E) the number of Egyptian Geese breeding pairs.
Graphs from model M1 (A–C) and M2 (D, E). Each hatchling is represented by a small dot; shading intensity of small dots increases with the overlap with other hatchlings thus darker dots indicate a higher number of hatchlings. Shaded area in A, B, D, E represents the 95% confidence interval (CI).

