Fig. 3.
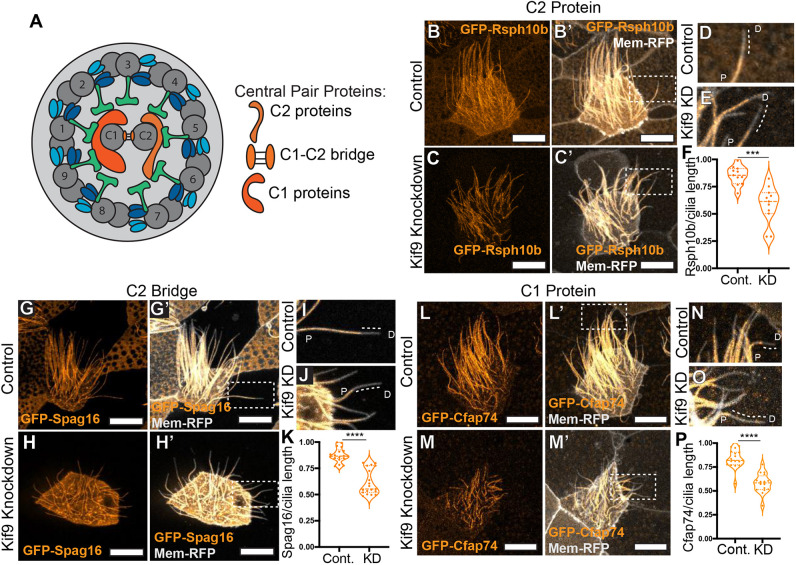
Kif9 contributes to central pair proteins and distal tip compartmentalization. (A) Schematic of 9+2 motile ciliary structure with central pair components schematized by tubule association. (B–C′) Confocal images of the localization of the radial spoke head component GFP–Rsph10B (orange) in control (B,B′) and Kif9 MO-injected (C,C′) embryos. (D,E) Magnified views of cilia from area indicated in B′,C′ for control (D) and (E) Kif9 KD cilia showing loss of GFP–Rsph10B (orange) from the distal ends of cilia. Dotted line outlines lack of protein at distal ends. (F) Quantification of GFP–Rsph10B length over total ciliary length in control and Kif9 KD embryos. (G–H′) Confocal images of GFP–Spag16 (orange) and membrane–RFP (gray) localization in Xenopus multiciliated cells in control (G,G′) and Kif9 MO (H,H′) injected embryos. (I,J) Magnified views of distal tips of cilia from area indicated in G′,H′ for control (I) and Kif9 KD (J) cilia showing loss of GFP–Spag16 (orange) from the distal tip of cilia. Dotted line outlining lack of protein at distal ends. (K) Quantification of GFP–Spag16 length over total ciliary length in control and Kif9 KD injected embryos. (L–M′) Confocal images of GFP–Cfap74 localization in control (L,L′) and Kif9 MO (M,M′) injected embryos. (N–O) Magnified views of distal tips of cilia from area indicated in L′,M′ for control (N) and Kif9 KD (O) cilia showing loss of GFP–Cfap74 (orange) from the distal tip of cilia. Dotted line outlining lack of protein at distal ends. (P) Quantification of GFP-Cfap74 length over total ciliary length in Control and Kif9 knockdown embryos. Results in F,K,P are shown as violin plots with the median and quartiles marked by dashed lines. ***P<0.001, ****P<0.0001 (unpaired two-tailed t-test). P, proximal; D, distal. Scale bars: 10 µm.

