Fig. 6.
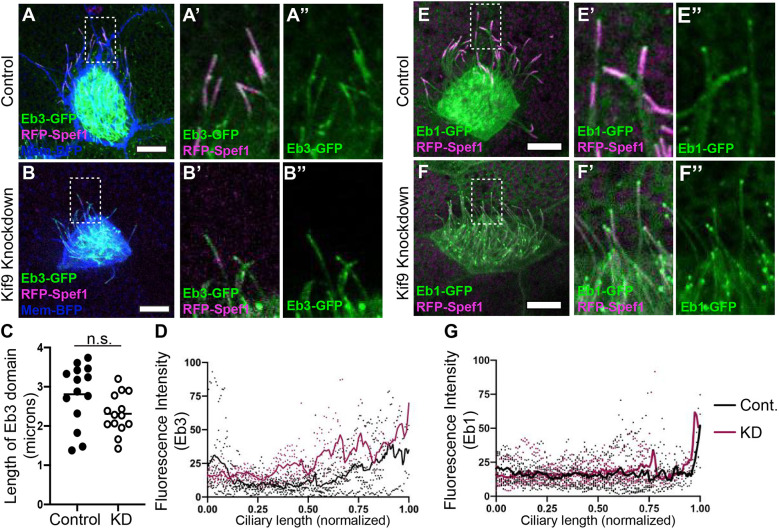
The microtubule plus-end-binding proteins Eb1 and Eb3 remain unaffected in the distal tip upon knockdown of Kif9. (A–B″) Confocal images of control (A–A″) and Kif9 MO-injected embryos (B–B″) with Eb3–GFP (green), RFP–Spef1 (magenta), and Membrane–BFP (blue). (A′,B′) Magnified views of area highlighted in A,B of ciliary tips with Eb3–GFP (green) and RFP–Spef1 (magenta) in control and KD cilia. (A″,B″) Magnified views of area highlighted in A,B of Eb3 alone in control and KD cilia. (C) Length measurements of Eb3 domain in control and Kif9 KD embryos. n.s., not significant (P=0.056) (unpaired two-tailed t-test). (D) Graph of line traces of fluorescence intensities of Eb3 in control and knockdown cilia. (E–F″) Confocal images of control (E–E″) and Kif9 MO-injected embryos (F–F″) with Eb1–GFP (green), RFP–Spef1 (magenta) and Membrane–BFP (blue). (E′,F′) Magnified views of area highlighted in E,F of ciliary tips with Eb1-GFP (green) an RFP–Spef1 (magenta) in Control and Knockdown cilia. (E″–F″) Magnified views of area highlighted in E,F of Eb1 alone in control and KD cilia. (G) Graph of line traces of fluorescence intensities of Eb1 in control and KD cilia. Images are representative of 30 different axonemes quantified across three independent replicates with 10 different embryos imaged for each replicate. Scale bars: 10 µm.

