Fig. 7.

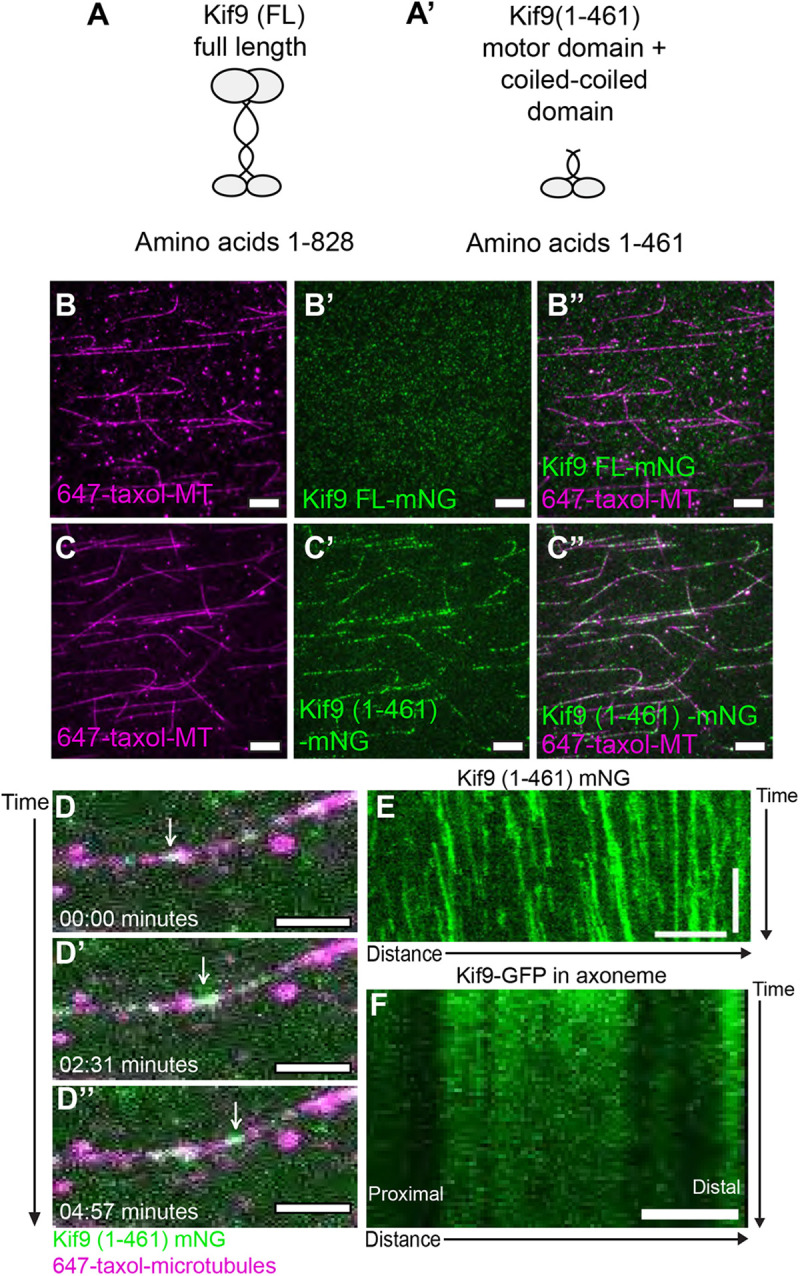
Motor activity of Xenopus Kif9. (A,A′) Schematic of Xenopus laevis Kif9 constructs made for single-molecule assays. (B–B″) Images from single-molecule microtubule binding assays for full-length Kif9 [Kif9 (FL), green) on Taxol-stabilized microtubules (magenta). (C–C″) Images from single-molecule microtubule-binding assays for a truncated version of Kif9 [Kif9 (1-461), green] on Taxol-stabilized microtubules (magenta). Scale bars: 10 µm. (D–D″) Still frames from live imaging of Kif9 processivity on microtubules in minutes. White arrow follows a Kif9 particle (green) moving along a microtubule (magenta). Scale bars: 2 μm. (E) Kymograph of live imaging of Kif9 (1-461)-mNG in vitro on microtubules. Scale bars: 2 min (vertical) and 5 µm (horizontal). (F) Kymograph of live imaging of Kif9–GFP construct in vivo in Xenopus laevis multiciliated cell axonemes. Images are representative of 30 different cells imaged across three independent replicates with at least 10 experiments imaged for each replicate. Scale bar: 2 μm
