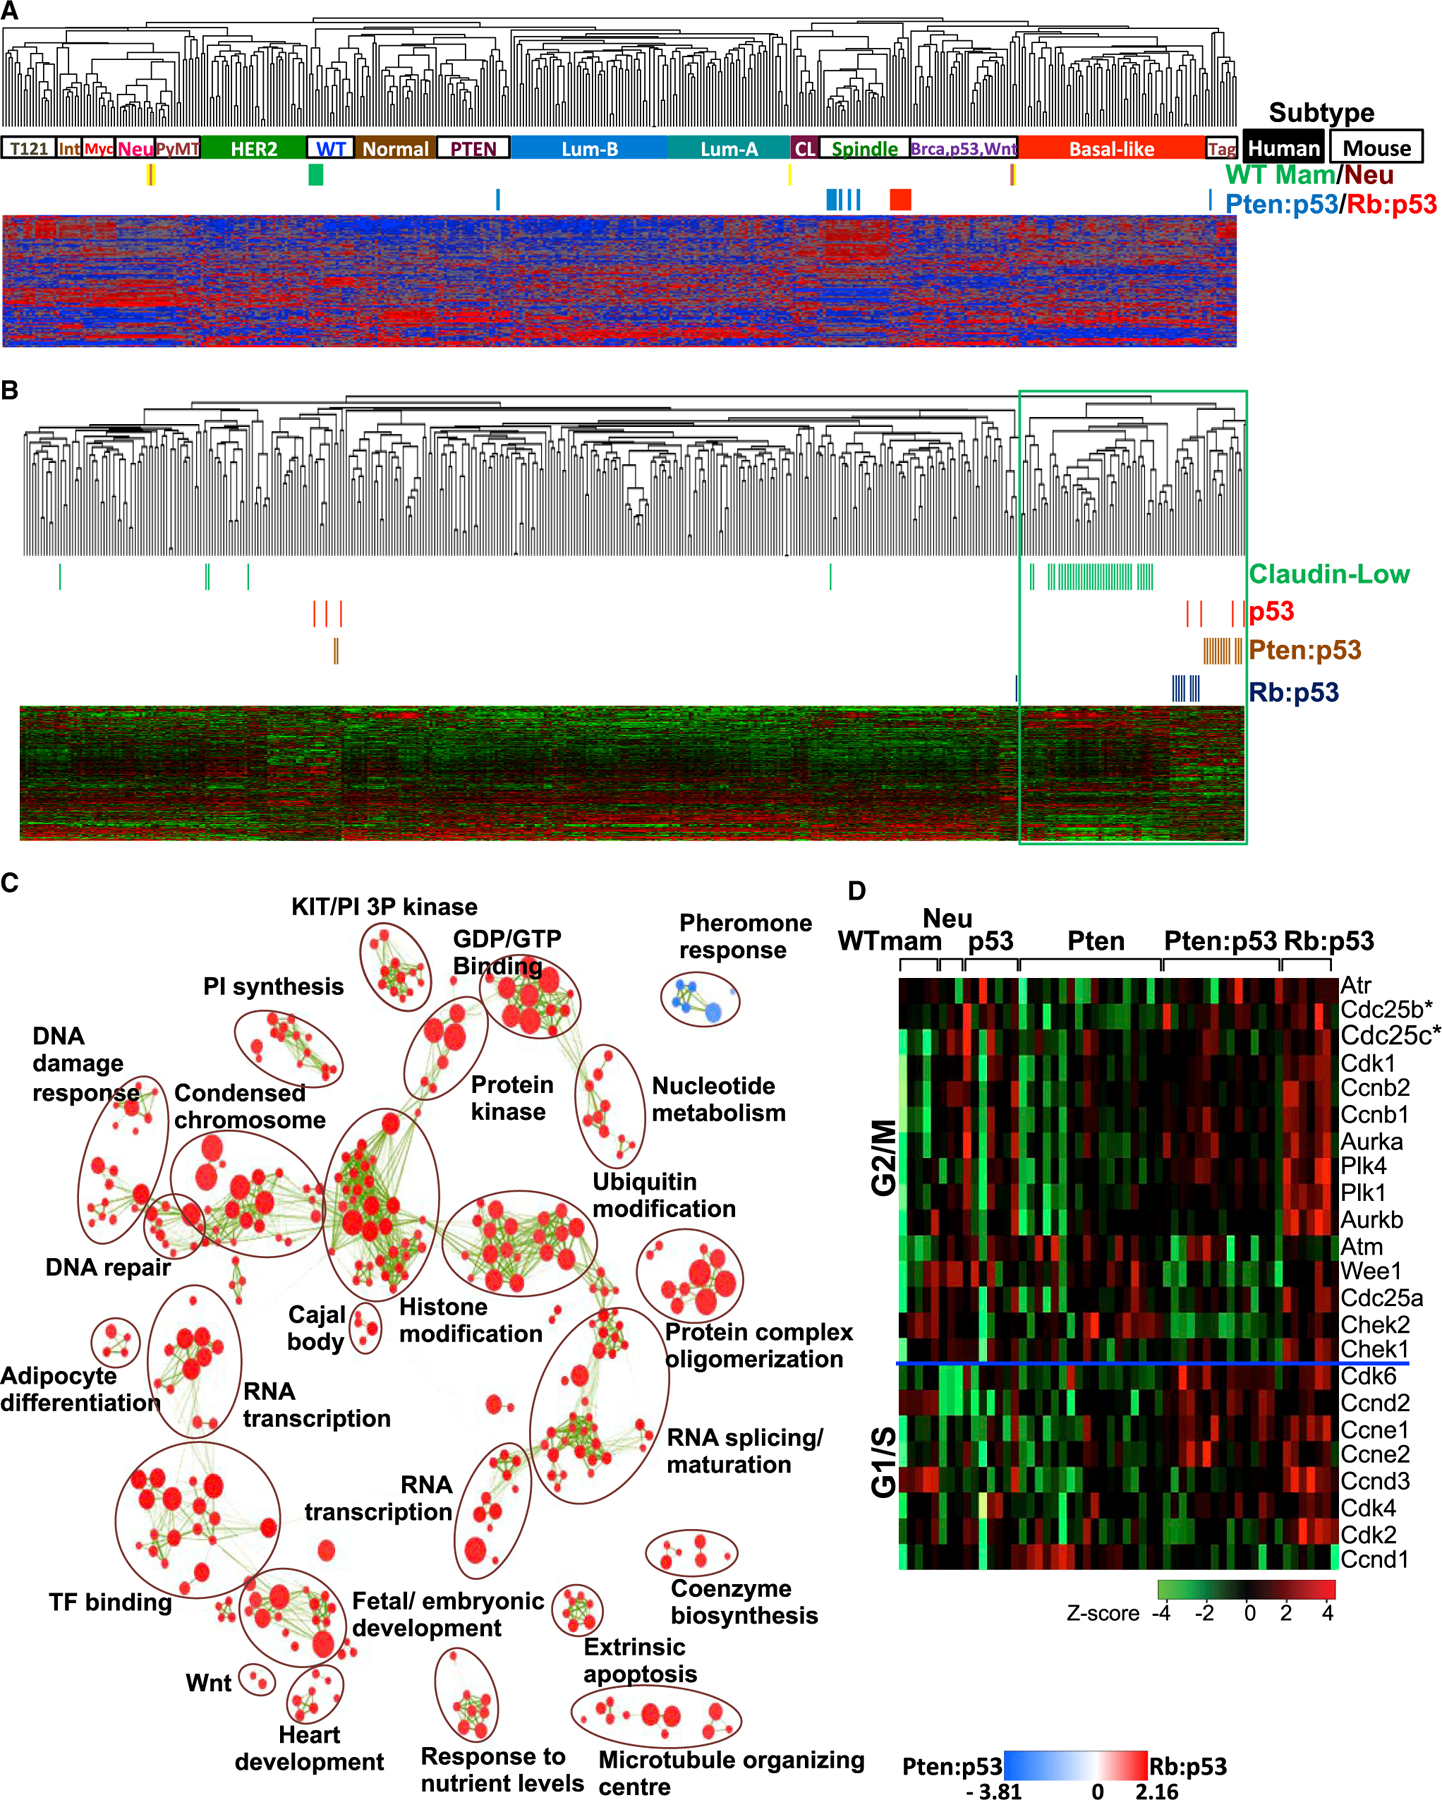
Figure 1. Cluster Analysis and Expression of CDC25 Pathway Genes in Pten/p53- and Rb/p53-Deficient Claudin-Low-Like Mammary Tumors.

(A) Cluster analysis of Pten/p53- and Rb/p53-deficient mammary tumors using an intrinsic gene signature in comparison with human BC samples (solid boxes indicate basal-like, CL, luminal-A, luminal-B, HER2, and normal samples) and mouse mammary tumors (open boxes indicate Spindle, WTM [WT mammary glands], Neu [MMTV-Neu], Myc [Myc-derived], PyMT [MMTV-PyMT], Int [MMTV-Int3], Tag [tag-derived], PTEN [Pten-deficient], and Brca,p53,Wnt [Brca1-deficient, p53-deficient, MMTV-Wnt1]). Accession number for Rb/p53, p53 tumors, and WT mammary gland: GSE62016 and for PTEN/p53, PTEN, and Neu tumors: GSE39955.
(B) Cluster analysis of Pten/p53- and Rb/p53-deficient mammary tumors with human claudin-low (green) BC using the Prat/Perou claudin-low signature.
(C) GSEA visualized by Enrichment Map in Cytoscape showing most significant pathways enriched in Rb/p53 (red) versus Pten/p53 (blue) tumors. Green lines indicate connections of overlapping pathways. A complete GSEA profile is shown in Figure S2A.
(D) Heatmap showing the expression of genes on the CDC25 pathway in indicated mouse models. Expression of Cdc25B and Cdc25C is significantly higher in p53, Rb/p53, and Pten/p53 relative to Pten tumors or normal mammary glands, respectively (statistical analysis is given in Figure S3).
See also Figures S2 and S3.
