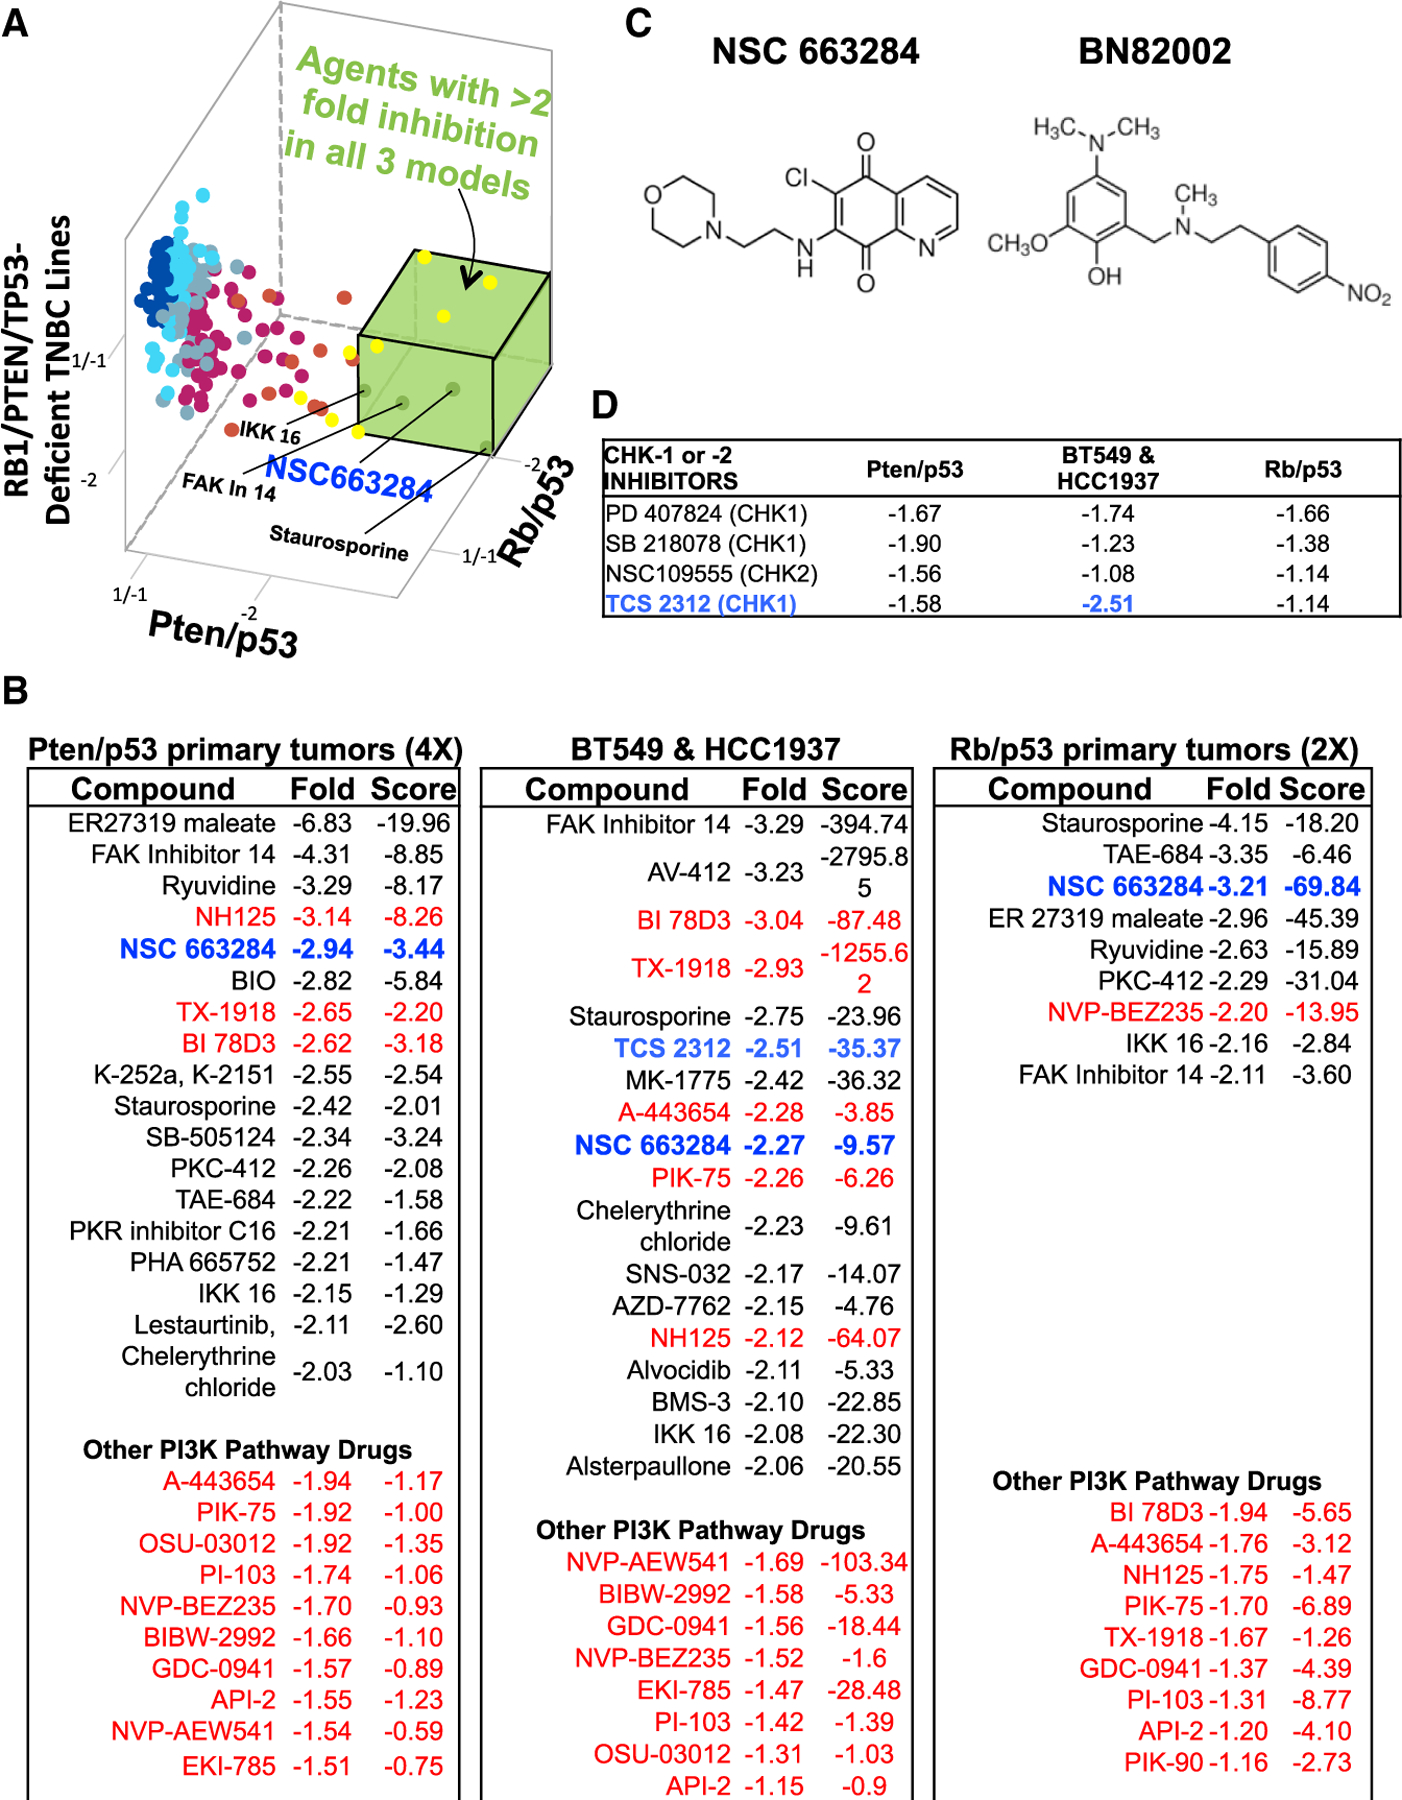
Figure 2. Identification of RB1/PTEN/TP53-Deficient TNBC-Suppressing Compounds.

(A) 3D representation (fold change calculated compared to non-treated cells) of kinase/phosphatase inhibitor screens on primary mouse Pten/p53 tumor, mouse Rb/p53 primary tumor cells, and human RB1/PTEN/TP53-deficient TNBC cell lines (BT549 and HCC1937). Compounds with >2-fold inhibition on all three models of TNBC cells (green box) are indicated.
(B) Top inhibitory compounds with fold change and T score (difference divided by SD) for the three groups of tumor cells. The CDC25 inhibitor NSC663284 is highlighted in blue; CHK1 inhibitor TCS-2312 is indicated in light blue; PI3K pathway inhibitors are indicated in red.
(C) Chemical structure of CDC25 inhibitors NSC663284 and BN82002.
(D) Effects of CHK1 and CHK2 inhibitors with fold change on the three groups of tumor cells.
