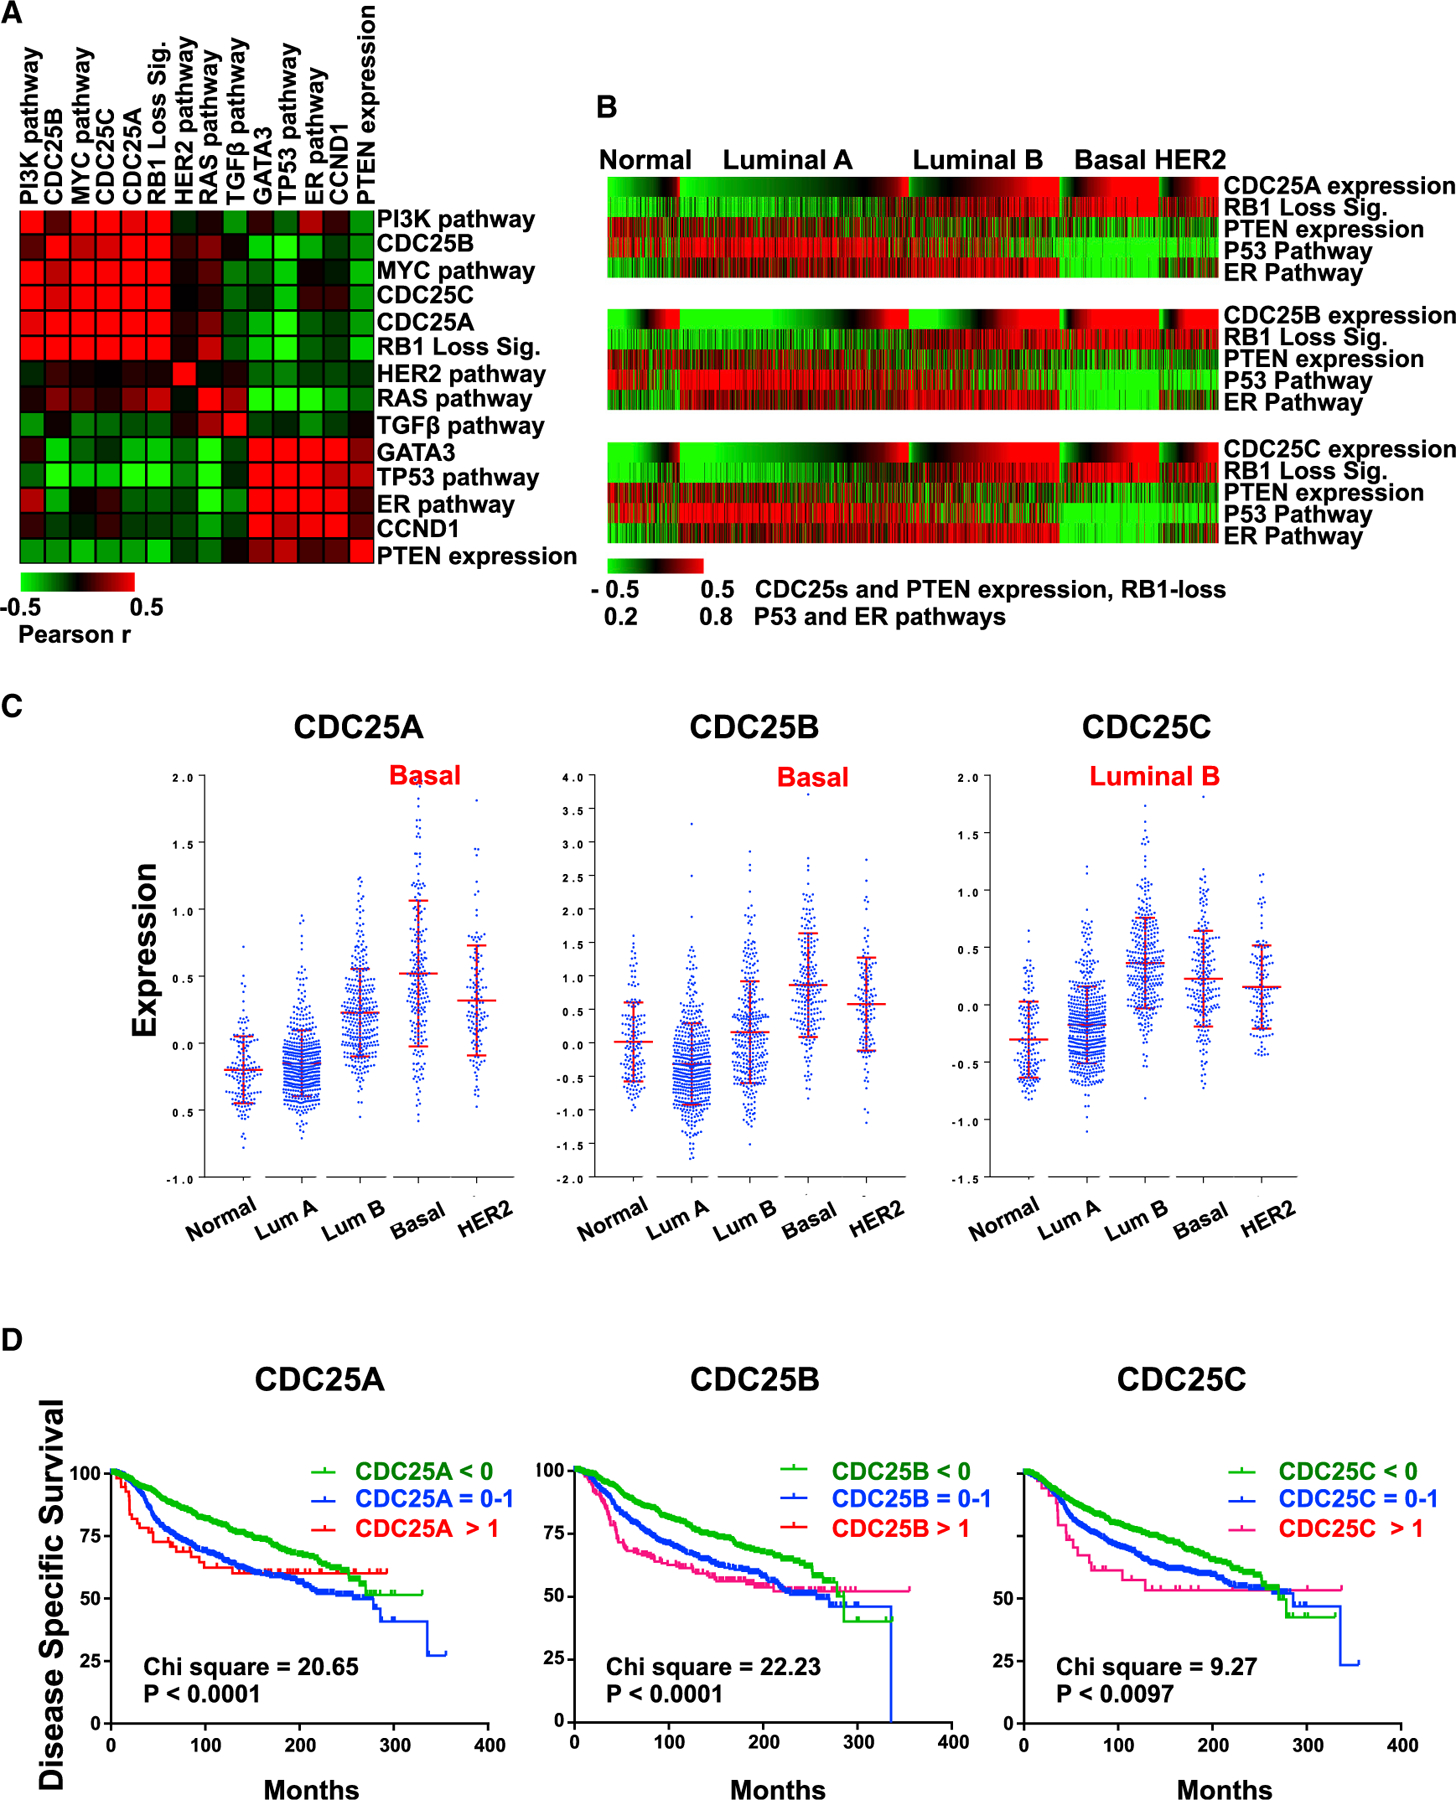
Figure 4. Expression of CDC25 Genes in Different BC Subtypes, Correlation with Various Oncogenic Alterations, and Impact on Clinical Outcome in Breast Cancer.

(A) Pairwise correlation analysis comparing CDC25 expression with indicated levels of oncogenes and tumor suppressors estimated by signatures, pathway activities, or gene expression in 1,302 BC samples using European Genome-phenome Archive: EGAD0010000434 (EGA; http://www.ebi.ac.uk/ega/). Results are organized by hierarchical clustering using Pearson correlations. Heatmap indicates the correlation coefficient values: red indicates positive correlation, and green indicates negative correlation.
(B) Correlation of CDC25 expression and tumor suppressor gene status in each BC subtype. The 1,302 BCs grouped by subtypes were ordered with CDC25A, CDC25B, and CDC25C expression values from low to high in each subtype. In all subtypes, expression of the three CDC25 genes correlates with loss of RB1, PTEN, TP53, and ER (positively with RB1 loss; negatively with PTEN expression, TP53, and ER pathway activity). For statistical analysis, see Figure S4.
(C) Expression distribution of CDC25A, CDC25B, and CDC25C in different BC subtypes. Highest expression of CDC25A and CDC25B was in basal-like BC; highest CDC25C expression was in luminal B. Error bars indicate mean ± SD; p < 0.0001 by ANOVA.
(D) Kaplan-Meier analysis of the 1,302 BC patients in correlation with CDC25A, CDC25B, and CDC25C expression; low, <0; medium, 0–1; high, >1. Indicated chi-square and p values were calculated using log-rank (Mantel-Cox) analysis.
See also Figure S4.
