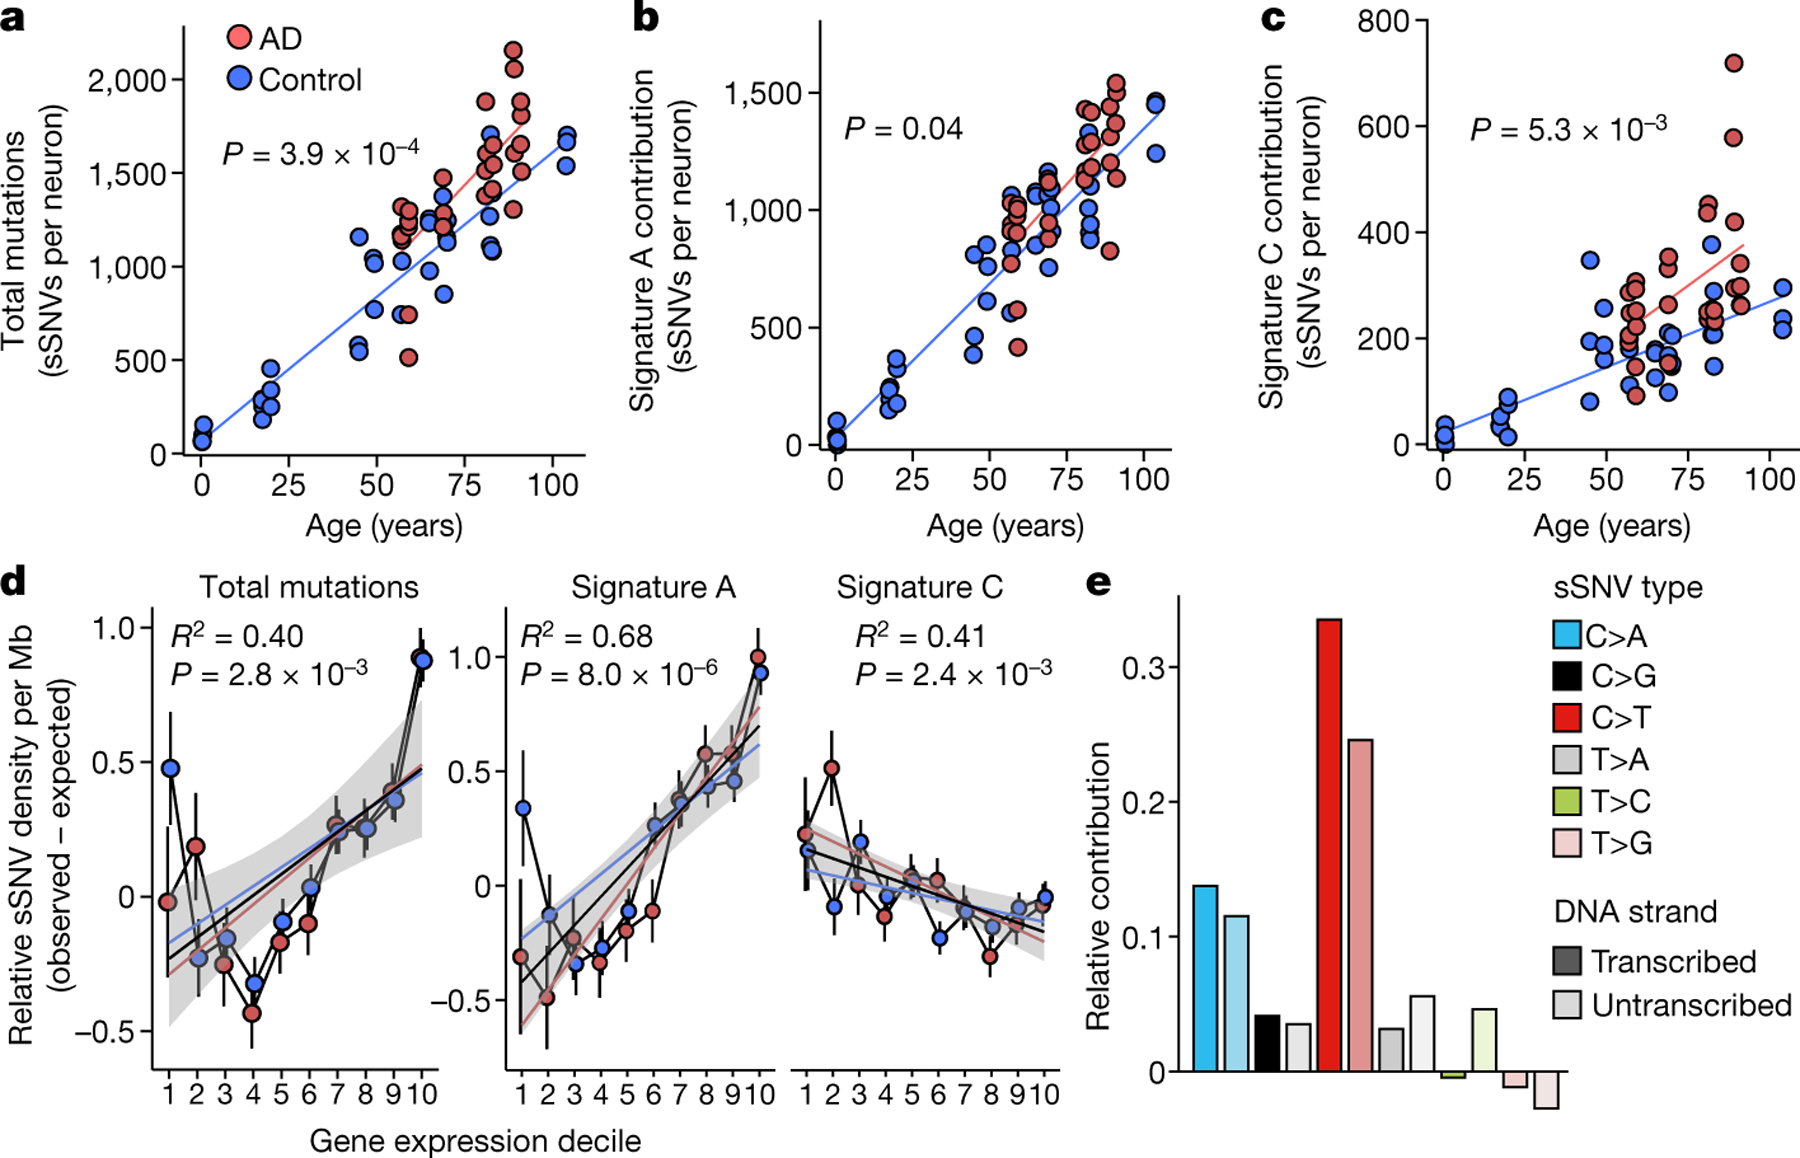
Fig. 3 |. Profile of somatic mutations in single AD neurons by PTA.

Single-neuronal nuclei were isolated from control and AD prefrontal cortex and subjected to PTA whole-genome amplification for scWGS. a, sSNVs as a function of age in neurotypical control individuals (blue) and individuals with AD (red). Blue and red lines show linear mixed model trend lines for each group (control: P = 2.0 × 10⁻¹⁶, R2 = 0.90; AD: P = 6.57 × 10⁻⁷, R2 = 0.59). By PTA, AD contributes a significant excess of sSNVs (196 per genome) in neurons compared to the normal ageing trend line (P = 3.9 × 10⁻⁴, linear mixed model). b, c, PTA-called sSNVs by mutational signature in each individual neuron. sSNV contributions are shown as a function of age for signature A (b; AD versus control P = 0.04, linear mixed model) and signature C (c; AD versus control P = 5.3 × 10⁻³, linear mixed model). d, Transcriptional influence on somatic mutation in neurons profiled by PTA. Genes with higher expression levels show increased overall and signature A density and decreased signature C density. Data points represent mean sSNV density relative to expected density based on the mutation trinucleotide context, with black vertical lines showing s.e.m. Controls represent age-matched (over 50 years old) neurotypical neurons. Overall trend line is shown in black; 95% CI in grey; and separate AD and control trend lines in colours. R2 and P values are shown for Pearson correlation. e, sSNVs by DNA strand template status. sSNVs in transcribed regions exhibit a strand bias in the excess mutations in AD neurons. For each nucleotide change, the proportional contributions of the transcribed and the untranscribed strand are shown. The strand bias ratio data in PTA-amplified neuron data showed a similar trend to that seen in MDA-amplified neurons.
