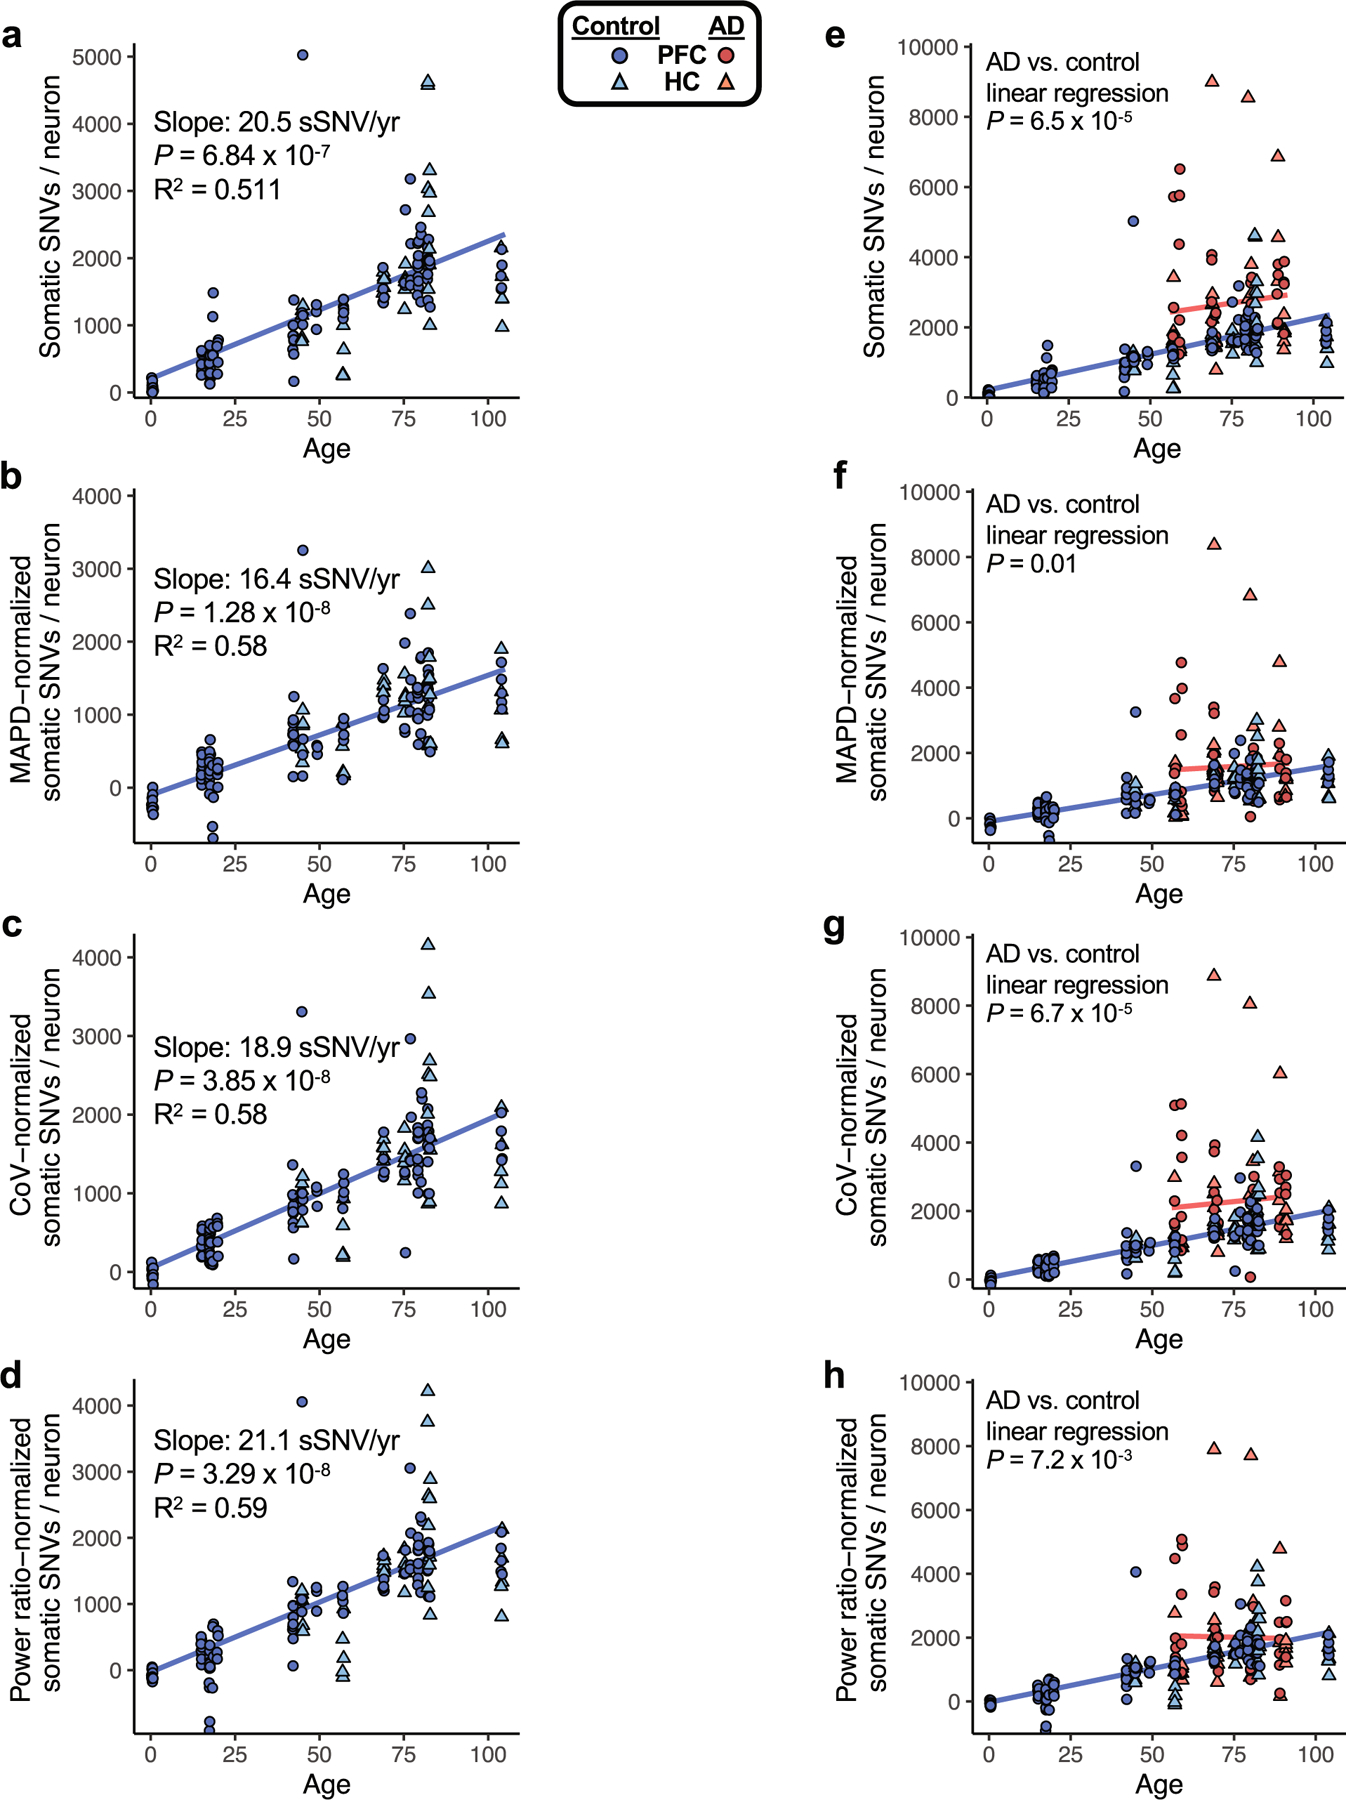
Extended Data Fig. 3 |. sSNVs in neurotypical control and AD neurons, normalized by evenness of genome amplification or LiRA caller power ratio.

To assess the sSNV, as determined by the variant calling approach used in this study, we plotted sSNV counts from MDA-amplified single neurons against age, including using sSNV counts that were normalized for two distinct measures of evenness of genome coverage, median absolute pairwise difference (MAPD) and coefficient of variation (CoV). We also normalized by the power ratio used in LiRA phasing-based sSNV detection (see Methods). a–d, sSNVs per genome for neurotypical control neurons, with mixed-effects modelling trend lines for ageing. We observed a significant age-dependent increase of sSNV burden in each analysis, with the slope for human pyramidal neurons ranging from 16.4 sSNV/yr to 21.1 sSNV/yr, depending on the method of adjustment for genome coverage evenness. For analysis of PFC region cells alone, we observed a similar range of slopes by this analysis: 16.8 sSNV/yr to 21.3 sSNV/yr. e–h, sSNVs in AD compared to neurotypical control neurons. Unadjusted for evenness (e, reproduced from Fig. 1h, AD neurons show a mean of 2672 (range 783-8990) sSNVs, an excess of 971 over controls (P = 6.5 × 10⁻⁵, linear mixed model). f, Normalized for MAPD, AD neurons show a mean of 1582 (range 33-8366) sSNVs, an excess of 480 over controls (P = 0.01, linear mixed model). g, Normalized for CoV, AD neurons show a mean of 2264 (range 68-8861) sSNVs, an excess of 831 over controls (P = 6.7 × 10⁻⁵, linear mixed model). h, Normalized for power ratio, AD neurons show a mean of 2015 (range 162-7892) sSNVs, an excess of 511 over controls (P = 7.2 × 10⁻³, linear mixed model). In each analysis, AD neurons showed a significantly greater number of sSNV compared to control neurons. Although some normalizations may result in reduced detection of biological differences in AD specimens, we observed that sSNV differences are retained even after normalization, supporting a sSNV difference between AD and control neurons.
