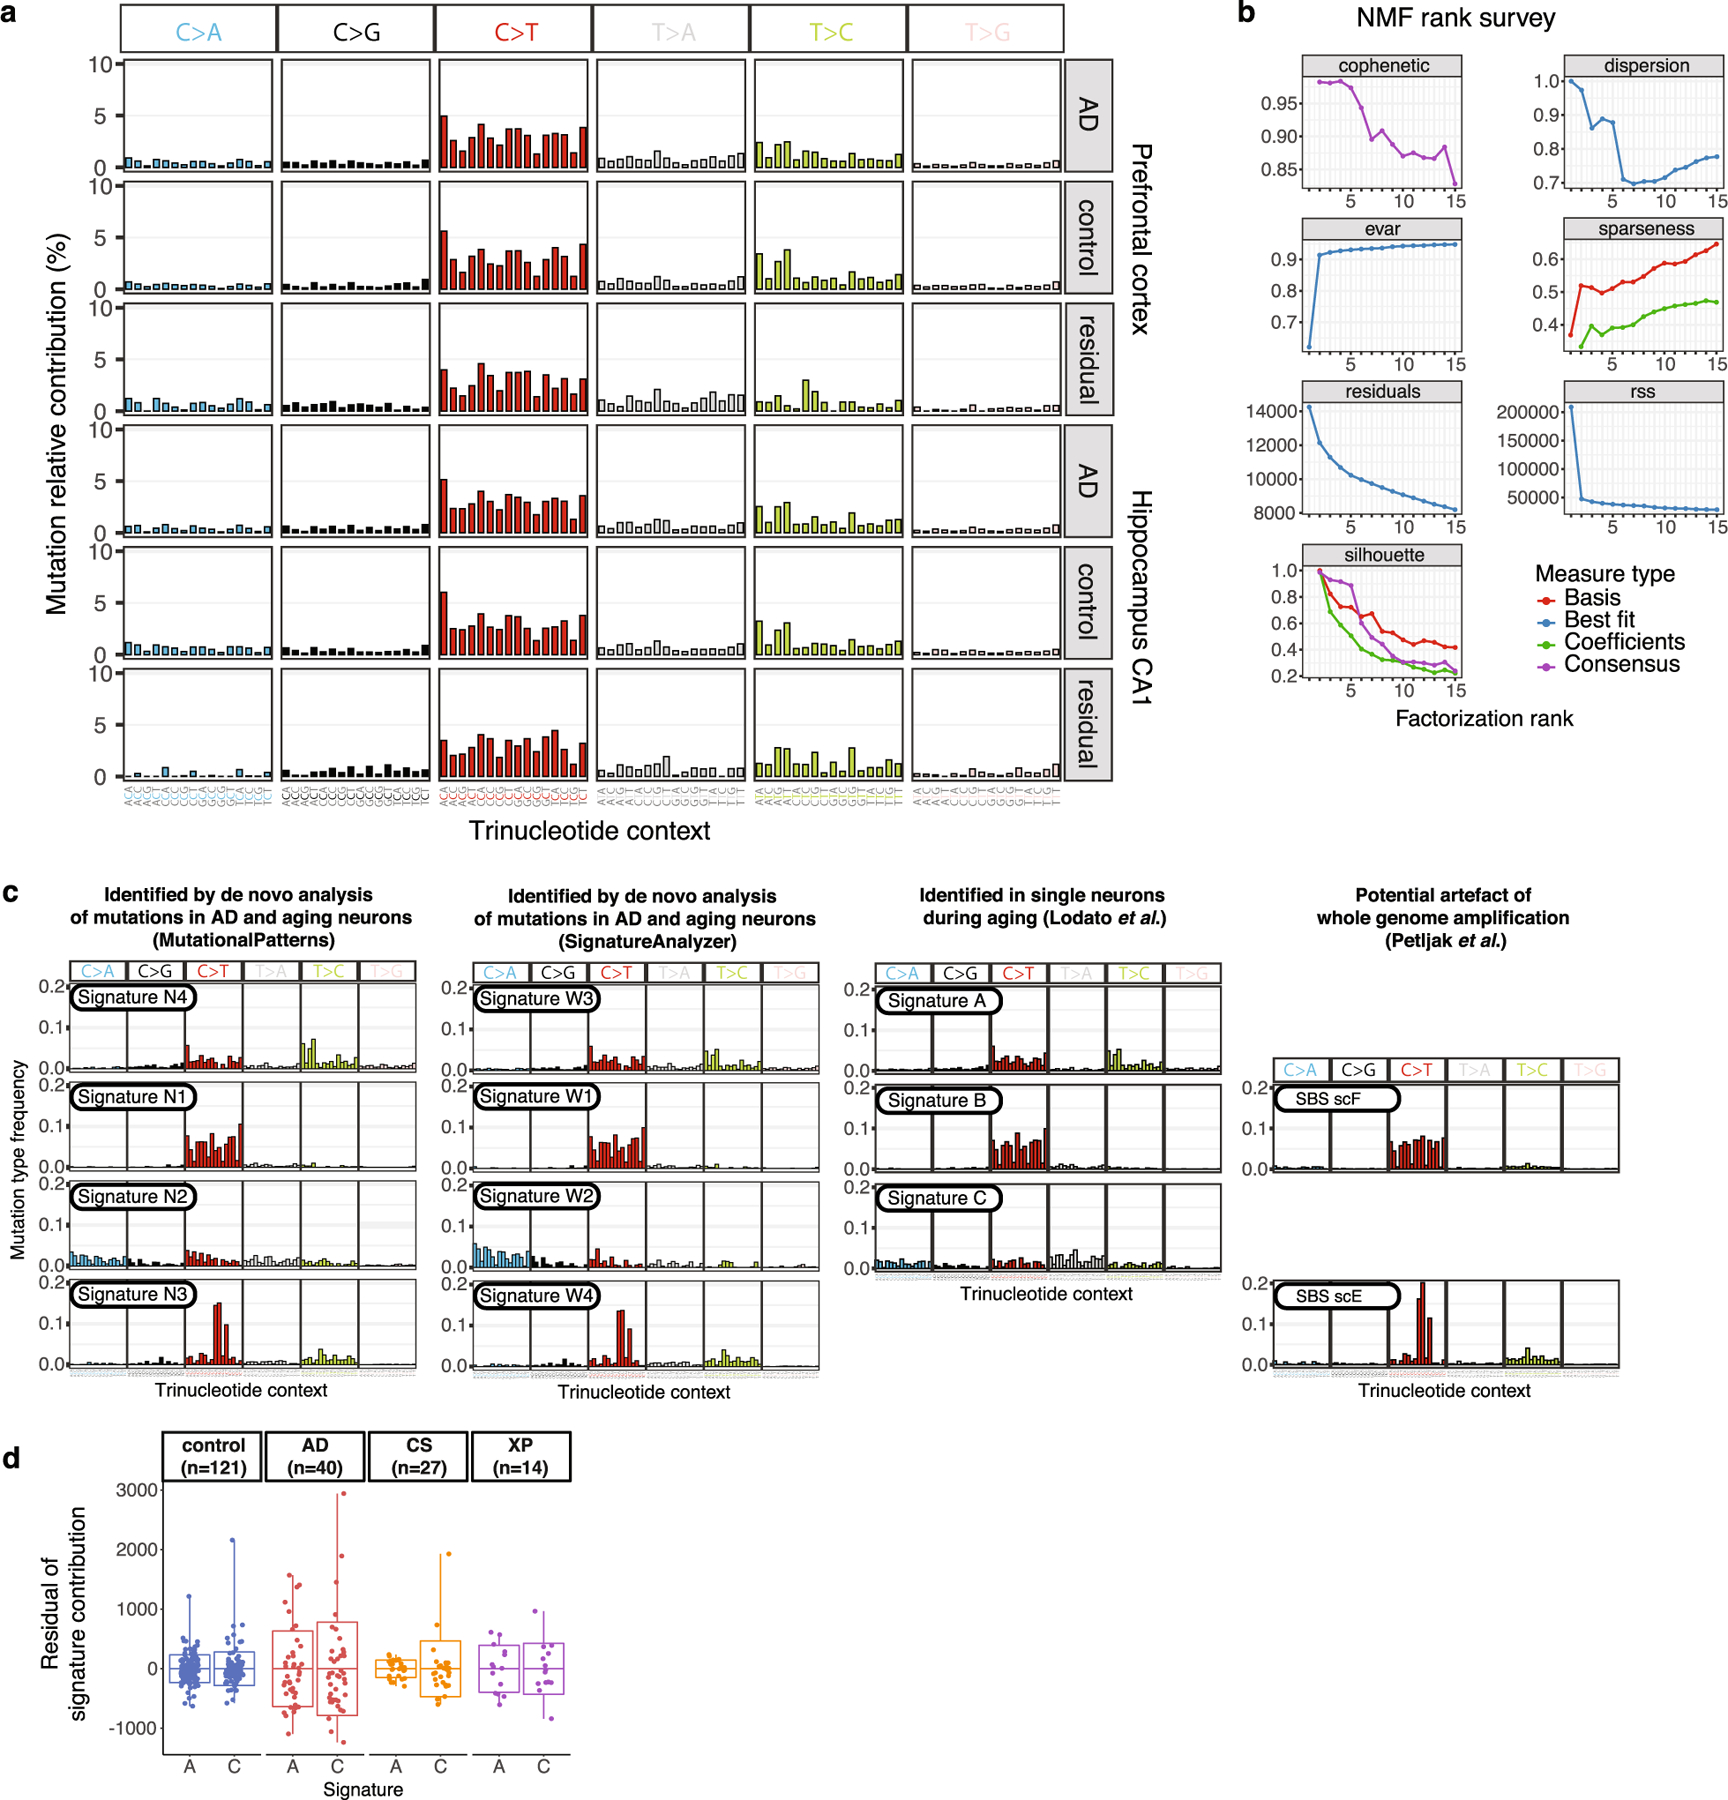
Extended Data Fig. 5 |. Somatic mutation trinucleotide context profiles and signature derivation in MDA-amplified single-neuron genomes.

a, Trinucleotide context somatic mutation profiles in AD and control neurons. Mutations called by LiRA are shown by base substitution change (bar colour), separated for each of the 16 possible trinucleotide contexts for each substitution (96 total trinucleotide contexts). For each brain region profiled, the aggregate is shown for AD cases, neurotypical controls, and the difference (residual of cases mutations minus control mutations). b, Signature metrics for de novo mutational signature derivation from neurons in this study. Using the frequency of sSNV mutations in their trinucleotide context for all control and AD neurons, we fitted mutational signatures with a NMF-based framework. We identified four signatures, N1-N4, that maximize the cophenetic of the decomposition81. c, sSNV mutational signatures evaluated in this study. We performed de novo mutational signature generation using NMF (MutationalPatterns and SignatureAnalyzer) on the set of scWGS data from single neurons from AD and neurotypical controls, which each produced 4 highly similar signatures by best fit. Previously published analysis of single neurons (Lodato et al.)5 during ageing produced 3 signatures: A, B, and C. A recently published study of cultured cells (Petljak et al.)24 identified signatures thought to represent artefacts of scWGS, including SBS scE and SBS scF. d, Variation between neurons of mutational signature contributions. We performed linear regression for signature contribution with respect to age and disease status. The residual signature contribution of each neuron for signature A and signature C is shown here, for each disease group. Also shown are the mean (bar) ± standard deviation (boxes), with the range (whisker lines). In addition to the neurotypical control and AD neurons reported in this manuscript, we also performed this analysis on previously reported single human neuron data for two NER-deficiency diseases: Cockayne syndrome (CS) and xeroderma pigmentosum (XP)5. Because only PFC was studied for CS and XP, only the control and AD neurons from PFC were used for this analysis. For each disease group, signature C showed a greater standard deviation than signature A; standard deviation ratios between signatures C and A are as follows: 1.2 (control), 1.2 (AD), 3.2 (CS), and 1.1 (XP). Data were obtained from MDA amplification of single neuron genomes. Boxplots show mean ± SD, with whiskers denoting minima and maxima.
