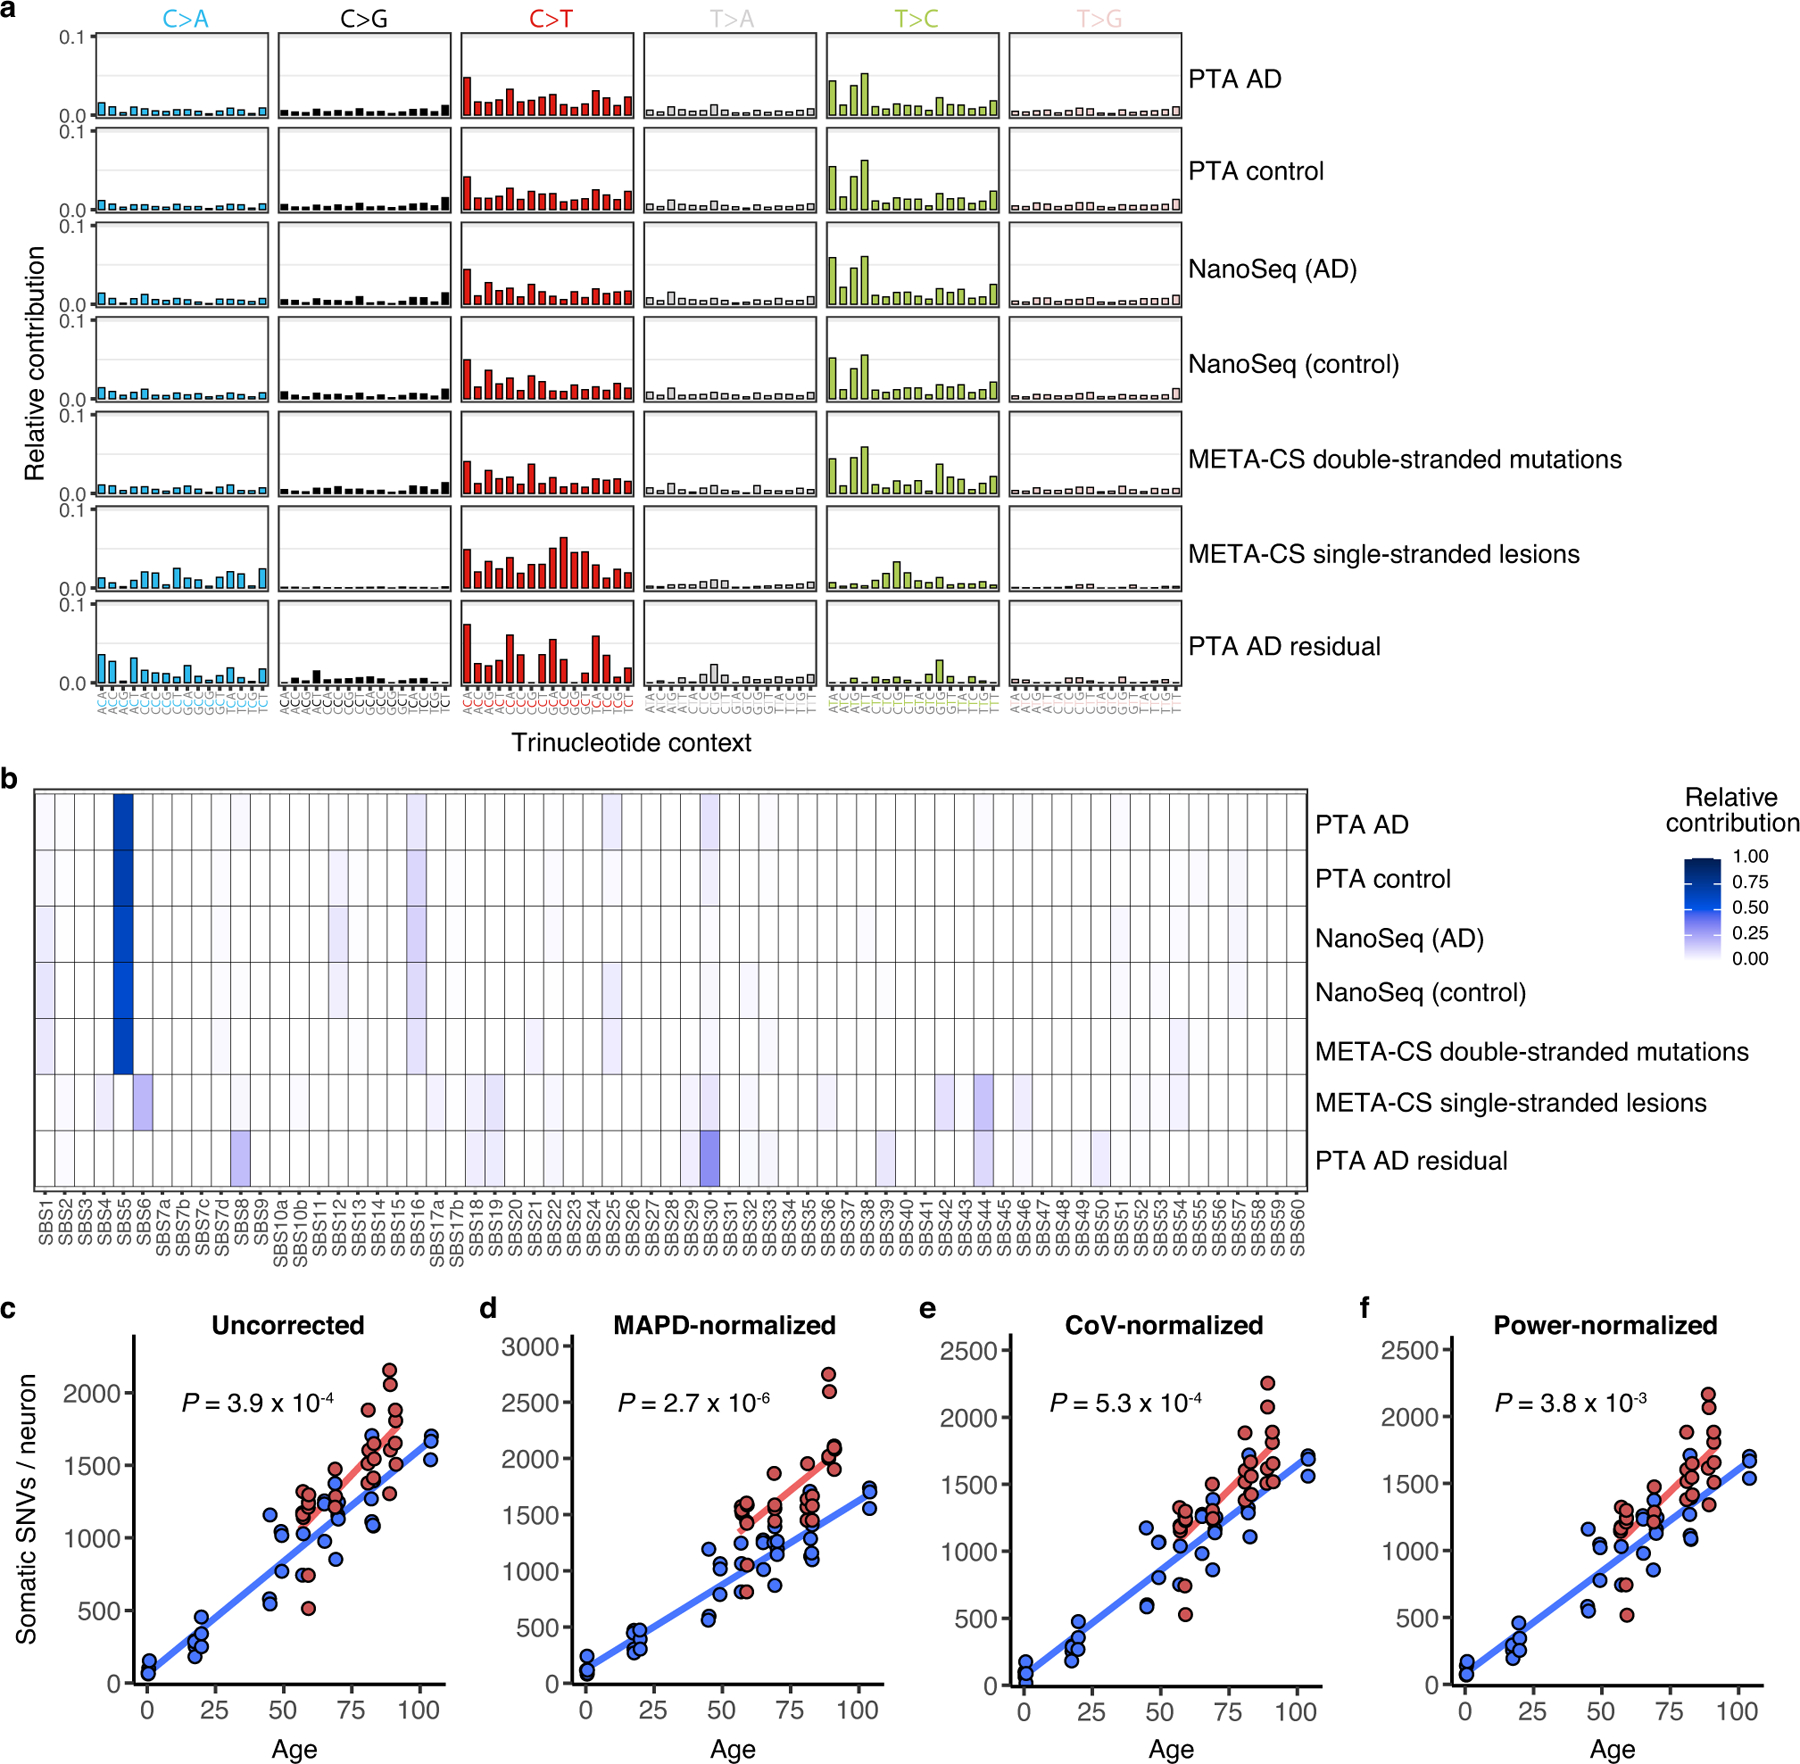
Extended Data Fig. 8 |. Features of somatic mutations in single neurons assessed by PTA.

a, Trinucleotide somatic mutation spectra of cells or bulk samples studied by various methods were compared. For PTA-amplified single neurons, the aggregate of mutations is shown for AD cases, age-matched neurotypical controls, and the residual (net increase of case mutations over control mutations). Mutational spectra from other methods include NanoSeq-studied bulk samples from AD or controls and META-CS single neuron data for double-stranded mutations or single-stranded DNA lesions. Mutations are shown by base substitution change (bar colour). Of note, single-stranded DNA lesions show a distinct profile from mutations detected by PTA, NanoSeq, and META-CS. b, The spectra of mutations detected in PTA-amplified neurons (AD, control, and AD residual) and from other published methods were analysed for contributions by COSMIC cancer signatures. Elements of COSMIC signatures identified in the AD residual mutation set, including SBS8, also contribute to signature C5. Of note, single-stranded DNA lesions show a distinct profile from mutations detected by PTA, NanoSeq, and META-CS. c–f, sSNV detected using PTA in AD and neurotypical control neurons, normalized by evenness of genome amplification or LiRA caller power ratio. c, Total sSNVs per genome plotted against age (uncorrected, reproduced here from Fig. 3a for comparison). AD neurons show a mean of 1419 (range 514–2157) sSNVs, an excess of 196 over controls (P = 3.9 × 10⁻⁴, linear mixed model). d, MAPD-normalized sSNVs per genome, from which AD neurons show a mean of 1703 (range 814-2748) sSNVs, an excess of 453 over controls (P = 2.7 × 10⁻⁶, linear mixed model). e, CoV-normalized sSNVs per genome, from which AD neurons show a mean of 1440 (range 527-2255) sSNVs, an excess of 189 over controls (P = 5.3 × 10⁻⁴, linear mixed model). f, Power-normalized sSNVs per genome, from which AD neurons show a mean of 1423 (range 517–2166) sSNVs, an excess of 198 over controls (P = 3.8 × 10⁻³, linear mixed model). In each analysis, AD neurons showed a significantly greater number of sSNV compared to control neurons.
