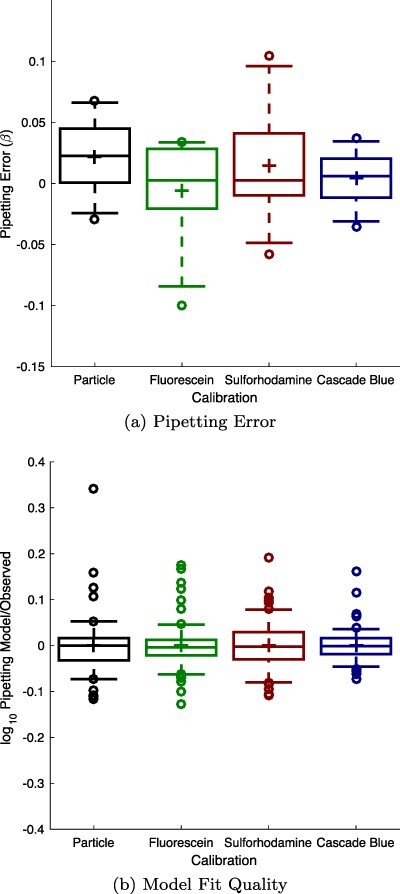
Figure 4.

Model fitting for sulforhodamine 101 and Cascade Blue finds no notable difference in either the pipetting error observed (a) or the fit quality of the resulting model, shown from the plot of the residual between the fitted response and the experimental data (b). In each box, plus indicates geometric mean, center line indicates median, top and bottom edges indicate 25th and 75th percentiles, and whiskers extend from 9–91%.
