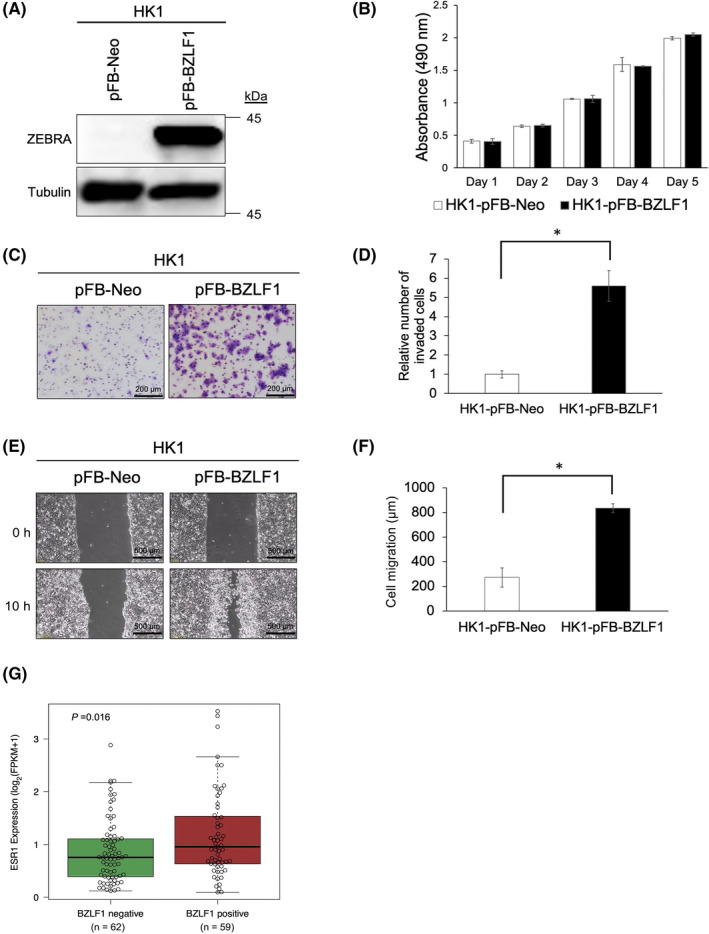
FIGURE 2.

Malignant cellular properties of ZEBRA and public RNA‐seq NPC data analysis. (A) HK1 cells expressing pFB‐Neo or pFB‐BZLF1 are assessed using western blotting. (B) Absorbance generated in cell‐mediated MTS assays of HK1 cells expressing pFB‐Neo or pFB‐BZLF1. (C) Representative images of transwell invasion assay in HK1 cells expressing pFB‐Neo or pFB‐BZLF1. (D) Comparison of the invaded cell counts in HK1‐pFB‐Neo or HK1‐pFB‐BZLF1. (E) Optical microscopy of the migration assay of HK1‐pFB‐Neo or HK1‐pFB‐BZLF1 at 0 and 10 h. (F) Comparison of the cell migration in HK1‐pFB‐Neo or HK1‐pFB‐BZLF1. (G) The ESR1 mRNA expression level in BZLF1‐negative group (n = 61) and positive group (n = 59). (B, D, F) The data are expressed as the mean ± standard deviation (SD). *p < 0.0001. (G) A t‐test is performed to determine the difference between the groups. The box plots represent the median, first, and third quartile
