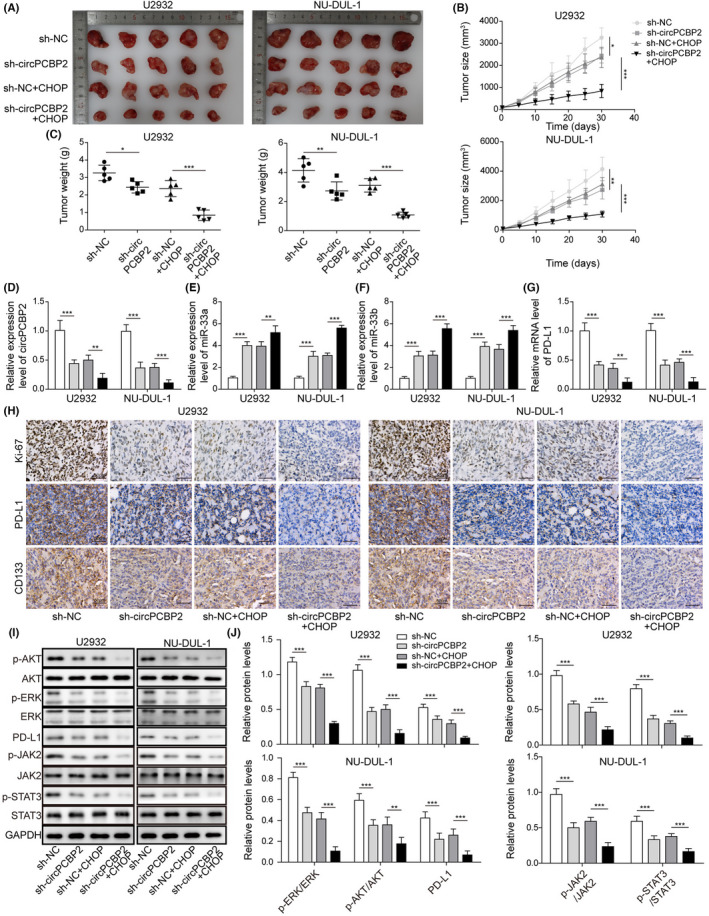
FIGURE 7.

circPCBP2 knockdown suppressed DLBCL growth and increased its sensitivity of CHOP in vivo. (A) Representative tumor images in each group. (B) Tumor volume with time. (C) Tumor weight in each group at different time. (D) qRT‐PCR analysis of circPCBP2 levels in tumors of each group. (E, F) Relative miR‐33a/b levels in tumors of each group. (G) Relative PD‐L1 mRNA levels in tumors of each group. (H) IHC staining to measure Ki‐67, PD‐L1, and CD133 levels in the tumors of each group. Scale bar, 50 μm. (I, J) Protein levels of p‐JAK2, JAK2, p‐STAT3, STAT3, p‐ERK, ERK, p‐AKT, AKT, and PD‐L1 in tumor tissues
