
FIGURE 5.
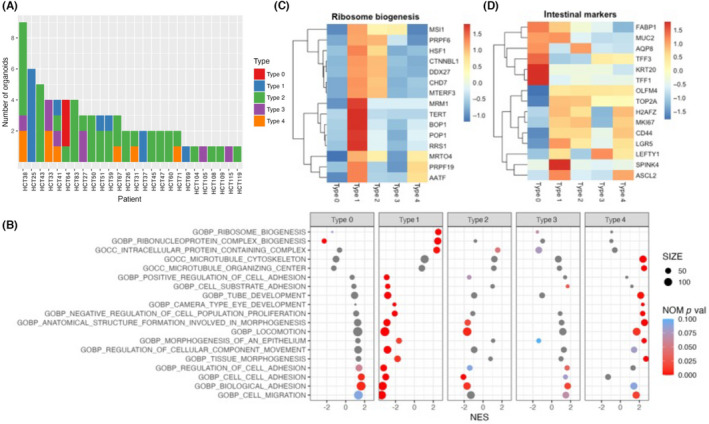
Gene expression profiles of type 0–4 patient‐derived organoids (PDOs). (A) Distribution of morphological types in patients with colorectal cancer. PDOs were assigned to type 0–4, and each type is shown for every patient. (B) Dot plot of Gene Set Enrichment Analysis results. Significantly increased or decreased gene sets derived from the C5 ontology gene set in Molecular Signature Database are listed. The color of the dots represents the false discovery rate value, and the diameter represents the enriched gene count. (C) Heatmap of core enrichment genes involved in ribosome biogenesis. (D) Heatmap of markers of intestinal tissue. NOM p val, nominal p value