
FIGURE 1.
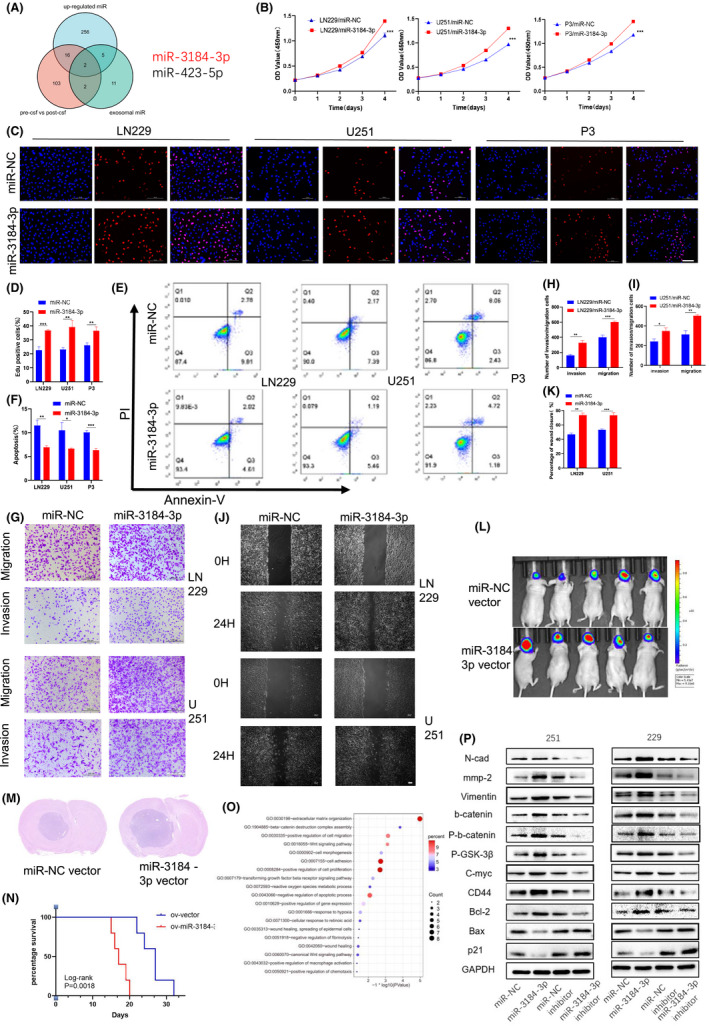
Pre‐CSF exosome enriched miR‐3184 promoted glioma progression. (A) Intersection of miRNA expression profile in patient samples. Exosomal miRNAs in CSF of glioma patients pre‐ (pre‐csf) and post‐ (post‐csf) tumor resection (red circle), exosomal miRNAs enriched in pre‐csf (green circle), and miRNAs upregulated in glioma tissue compared with normal brain tissue (blue circle) are shown. (B) The proliferation of glioma cells was examined by CCK8 assays after miR‐3184 overexpression. (C) The proliferation of glioma cells was examined by EdU assay after miR‐3184 overexpression. Scale bar = 100 µm. (D) Quantification of the results in (C). Data are presented as the means ± SD, n = 3 (*P < 0.05). (E) Apoptotic cells examined by flow cytometry. (F) Quantification of the results in (E). Data are presented as the means ± SD, n = 3 (*P < 0.05). (G) Invasion and migration abilities examined by Transwell assay. Scale bar = 200 µm. (H and I) Quantification of the results in (G). Data are presented as the means ± SD, n = 3 (*P < 0.05). (J) Wound healing assay examining glioma migration. Scale bar = 100 µm. (K) Quantification of the results in (J). Data are presented as the means ± SD, n = 3 (*P < 0.05). (L) Bioluminescence imaging showed the tumor sizes of each mouse, n = 10. (M) H&E staining of brain slices of mice in (L). (N) Kaplan–Meier survival curves for animals in each group. Log‐rank test, n = 10. (O) GO analysis for genes upregulated after miR‐3184 overexpression. (P) Western blot for proteins related to EMT, migration, proliferation, apoptosis, and wnt‐b‐catenin pathway [Correction added on 5 July 2022, after first online publication: in figure 1L, the image of the animal experiment data is wrong and is now corrected in the replacement figure].