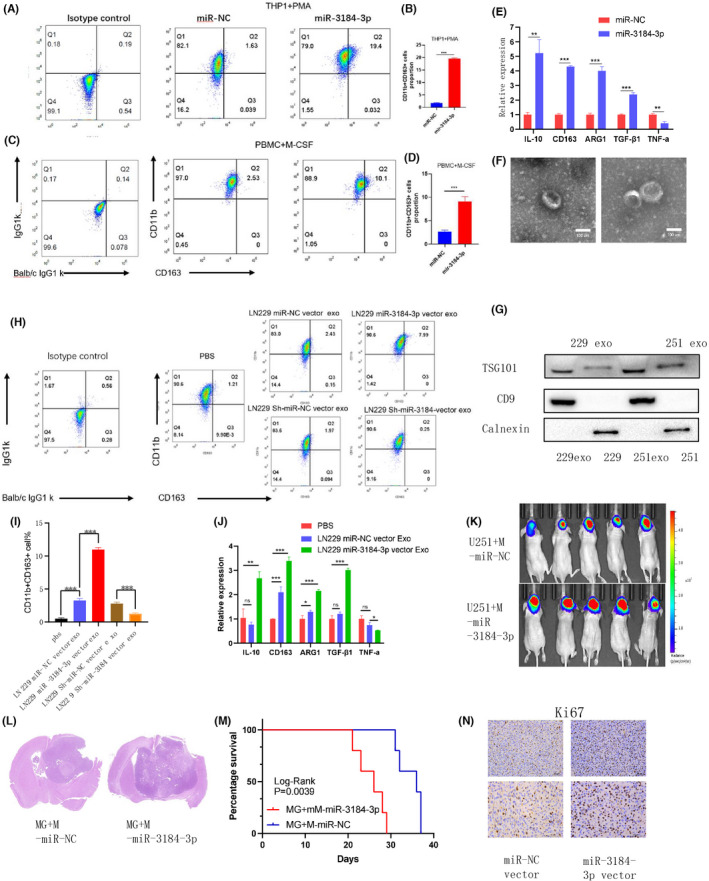
FIGURE 4.

Exosomal miR‐3184 promoted M2‐like polarization in macrophages. (A) CD11b and CD163 positive cells examined by flow cytometry. (B) Quantification of the results in (A). Data are presented as the means ± SD, n = 3 (*P < 0.05). (C) CD11b and CD163 positive cells examined by flow cytometry. (D) Quantification of the results in (C). Data are presented as the means ± SD, n = 3. (E) mRNA expression of M1 and M2 markers after miR‐3184 overexpression in macrophages. Data are presented as the means ± SD, n = 3 (*P < 0.05). (F) Representative images for exosomes. Scale bar = 100 nm. (G) Western blot for exosome markers. (H) CD11b and CD163 positive cells examined by flow cytometry. (I) Quantification of the results in (H). Data are presented as the means ± SD, n = 3 (*P < 0.05). (J) mRNA expression of M1 and M2 markers in macrophages after different exosome treatments. Data are presented as the means ± SD, n = 3 (*P < 0.05). (K) Bioluminescence imaging showed the tumor sizes of each mouse, n = 10. (L) H&E staining of brain slices of mice in K. (M) Kaplan–Meier survival curves for animals in each group. Log‐rank test, n = 10. (N) Representative images of the IHC staining of Ki67, n = 3. Scale bar = 50 μm
