FIGURE 2.

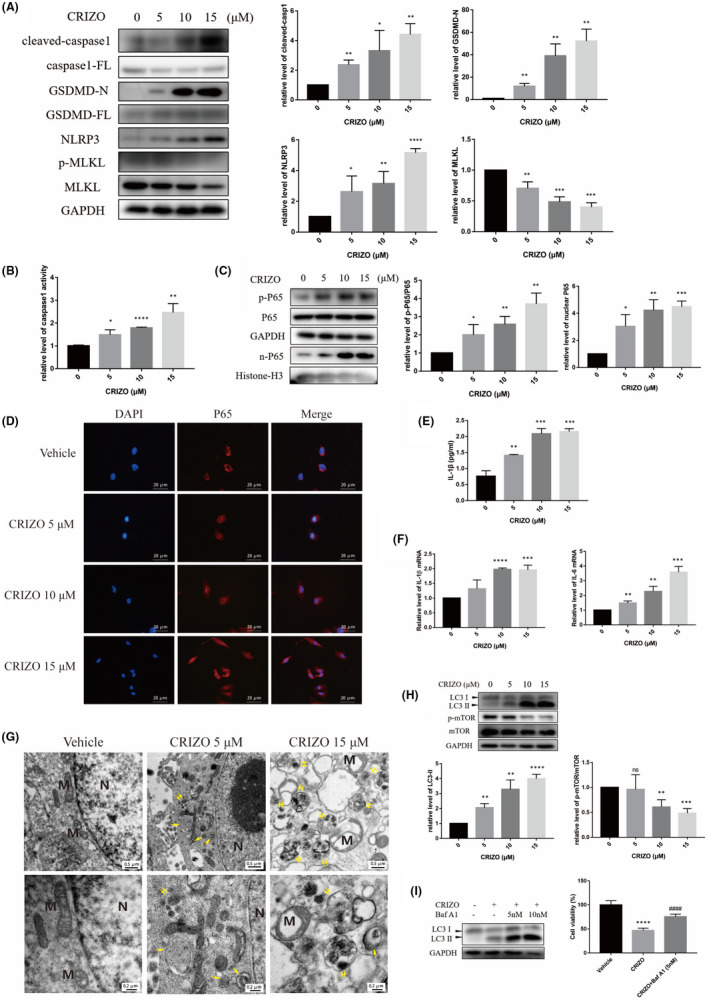
CRIZO promoted hepatocyte pyroptosis and autophagy. (A, G) After HL‐7702 cells were exposed to CRIZO (0–15 μM) for 24 h, the expression levels of cleaved‐caspase1, full‐length caspase1 (caspase1‐FL), GSDMD‐N, full‐length GSDMD (GSDMD‐FL), NLRP3, MLKL, phosphorylated MLKL, LC3, mTOR and phosphorylated mTOR in different groups were determined by Western blotting (n = 3). (B) HL‐7702 cells' caspase1 activity was determined after CRIZO administration for 24 h (n = 3). (C) The expression levels of phosphorylated P65 in whole cell and P65 in nucleus were determined by Western blotting (n = 3). (D) Nuclear translocation of P65 was observed by immunofluorescence labelling with DAPI (blue) and anti‐P65 (red). Scale bar: 20 μm. (E) IL‐1β secretion from HL‐7702 cells analysed by ELISA (n = 3). (F) The transcription levels of IL‐1β and IL‐6 were determined by qRT‐PCR. (G) The representative transmission electron micrographs of the HL‐7702 cells (n = 3). N, nucleus; M, mitochondrion; single arrow: autophagosome; double arrow: autophagolysosome; Scale bar in upper row images: 0.5 μm, scale bar in lower row images: 0.2 μm. (H) The expression levels of LC3 and phosphorylated P65 were determined by Western blotting. (I) HL‐7702 cells were treated by CRIZO with or without Baf A1 for 24 h, the levels of LC3 were determined by Western blotting (n = 3) and the cell viability was measured by CCK8 assay (n = 5). The data are expressed as the mean ± SD; *p < 0.05, **p < 0.01, ***p < 0.001 and ****p < 0.0001 vs. vehicle group; #### p < 0.0001 vs. CRIZO 15 μM treatment group.
