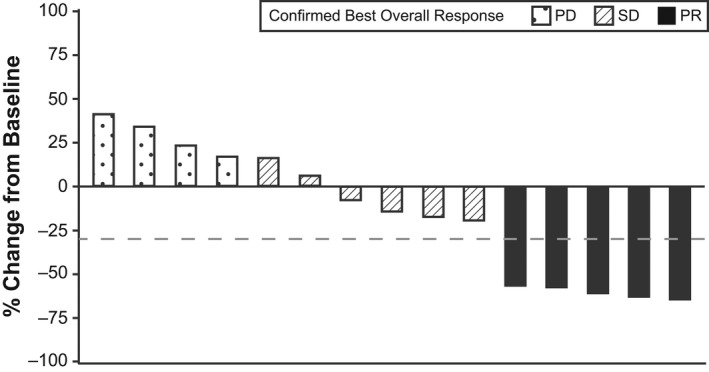
FIGURE 2.

Maximum percentage change in target lesions in patients in dose expansion phase (part 2). The best overall response was evaluated by the independent review. Data from 15 patients are shown. Two patients were not evaluable because they did not undergo postbaseline scans because of withdrawal (one death and one patient decision). The dashed line represents a 30% decrease. PD, progressive disease; PR, partial response; SD, stable disease
