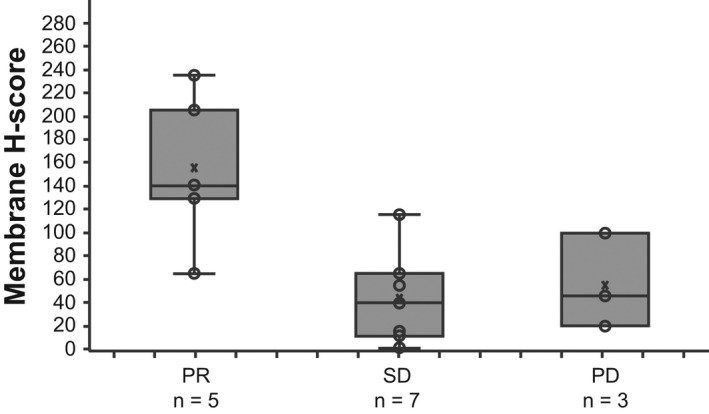
FIGURE 4.

Tumor membrane H‐score for tissue factor at baseline among patients in dose‐expansion phase (part 2) by best confirmed overall response. The lines within the boxes represent the median, whiskers extend to the most extreme observation within 1.5 times the interquartile range from the nearest quartile, X's represent the mean, and circles represent individual tumor samples. PR, partial response; PD, progressive disease; SD, stable disease
