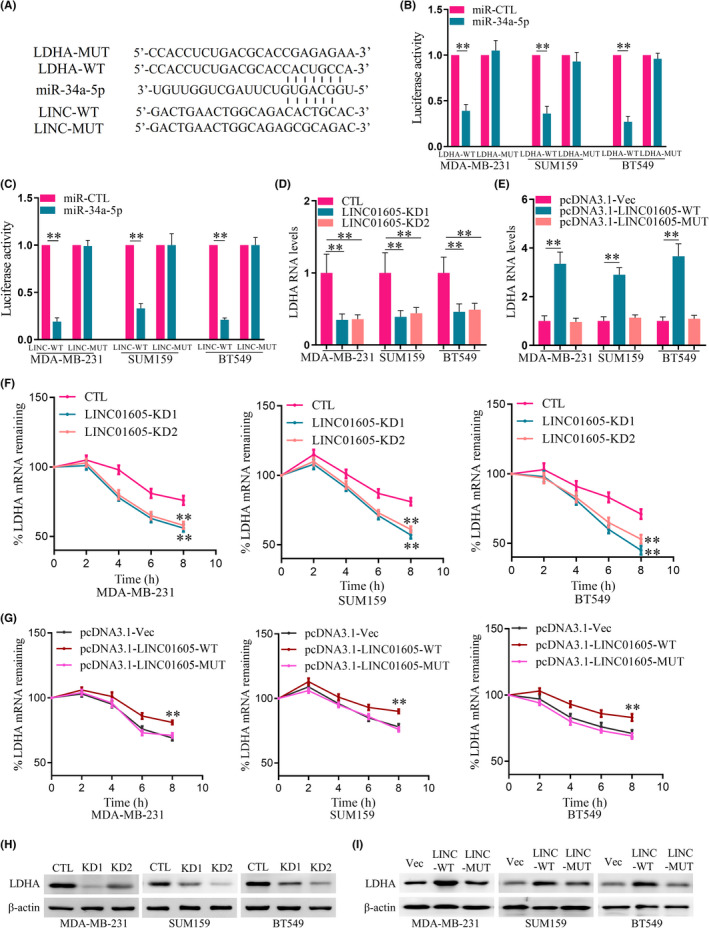
FIGURE 5.

LINC01605 knockdown (KD) decreases lactate dehydrogenase A (LDHA) level. (A) Putative microRNA (miR)‐34a‐5p target sites in LDHA and LINC01605 are shown in the schematic. (B, C) A dual‐luciferase reporter assay was carried out to investigate the interactions between miR‐34a‐5p LDHA and LINC01605. Renilla luciferase activity was normalized to firefly activity and shown as a relative activity. (D) Quantitative RT‐PCR (qRT‐PCR) analyses of LDHA RNA expression in LINC01605‐KD and control (CTL) cells. GAPDH was used as an endogenous control. (E) qRT‐PCR analyses of LDHA RNA expression in LINC01605 overexpression and control cells. GAPDH was used as an endogenous control. (F) Breast cancer cells were treated with actinomycin D (10 μg/ml) for the indicated times. LDHA mRNA levels were measured by qRT‐PCR in LINC01605‐KD and control cells. GAPDH was used as an endogenous control. (G) Breast cancer cells were treated with actinomycin D (10 μg/ml) for the indicated times. LDHA mRNA levels were measured by qRT‐PCR in LINC01605 overexpression and control cells. GAPDH was used as an endogenous control. (H) Western blot analyses of LDHA protein expression in LINC01605‐KD and control cells. (I) Western blot analyses of LDHA protein expression in LINC01605 overexpression and control cells. **p < 0.01. MUT, mutant; Vec, vector
