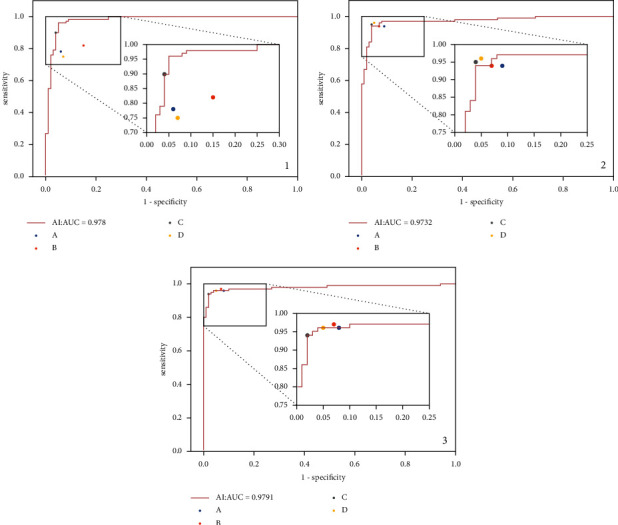
Figure 3.

(a–c) The ROC curve of AI diagnosis and the sensitivity and specificity of four doctors' diagnosis in the first, second, and third rounds. It can be seen from (a) that, in the first round, the AUC of AI diagnosis was 0.978. Among the four doctors, the diagnostic accuracy of doctor C was roughly equal to that of AI and the diagnostic accuracy of doctors A, B, and D was significantly lower than that of AI. In the second stage, the AUC of AI diagnosis was 0.973. Among the four doctors, the diagnostic accuracy of doctor C and doctor D was slightly higher than that of AI, the diagnostic accuracy of doctor B was roughly the same as that of AI, and the diagnostic accuracy of doctor A was slightly lower than that of AI. In the third round, the AUC of AI diagnosis was 0.979. Among the four doctors, the diagnostic accuracy of doctor B was slightly higher than that of AI, and the diagnostic accuracy of doctors A, C, and D was roughly the same as that of AI.
