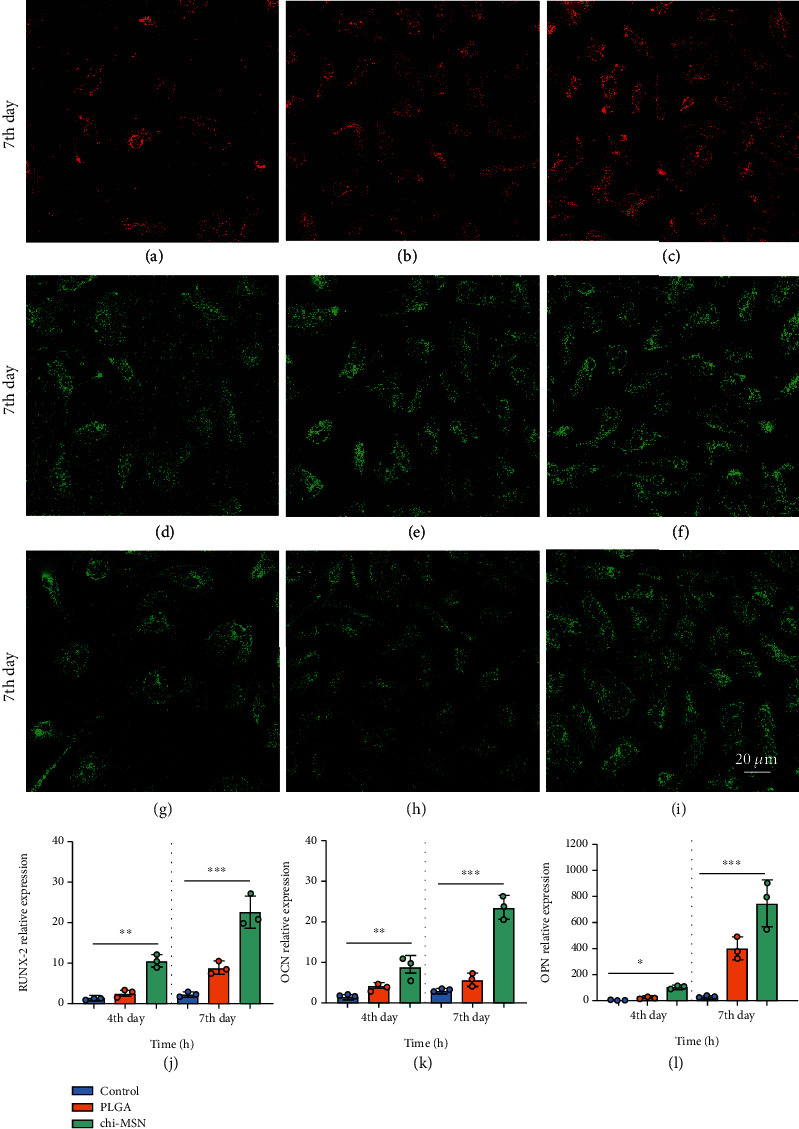
Figure 7.

Detection of related osteogenic genes. (a–c) RUNX-2 fluorescent staining results of control, PLGA, and Chi-MSN groups. (d–f) OCN fluorescent staining results of control, PLGA, and Chi-MSN groups. (g–i) OPN fluorescent staining results of control, PLGA, and Chi-MSN groups. (j, k) Quantitative evaluation of RUNX2, OCN, and OPN relative expression in control, PLGA, and Chi-MSN groups. ∗∗P < 0.01 and ∗∗∗P < 0.001 vs. control or PLGA group.
