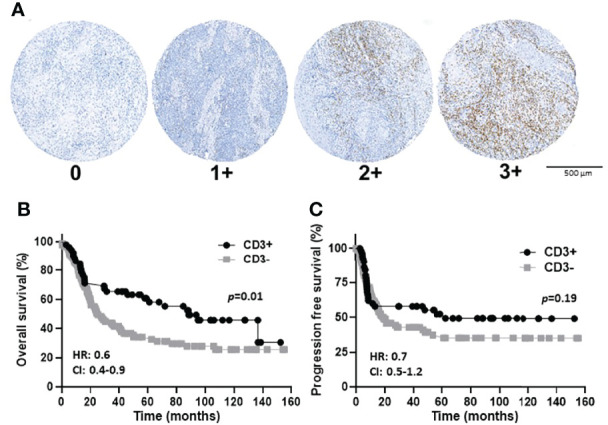
Figure 4.

CD3 immunostaining and expression scores in OSCCs. (A): Shown are images of no [0], low [1+], moderate [2+], and strong [3+] CD3 expression scores. (B, C): Shown are Kaplan-Meier estimates of the overall survival (B) and progression free survival (C) of CD3+ (2+ and 3+) and CD3- (0 and 1+) patients. HR, hazard ratio; CI: 95% confidence interval.
