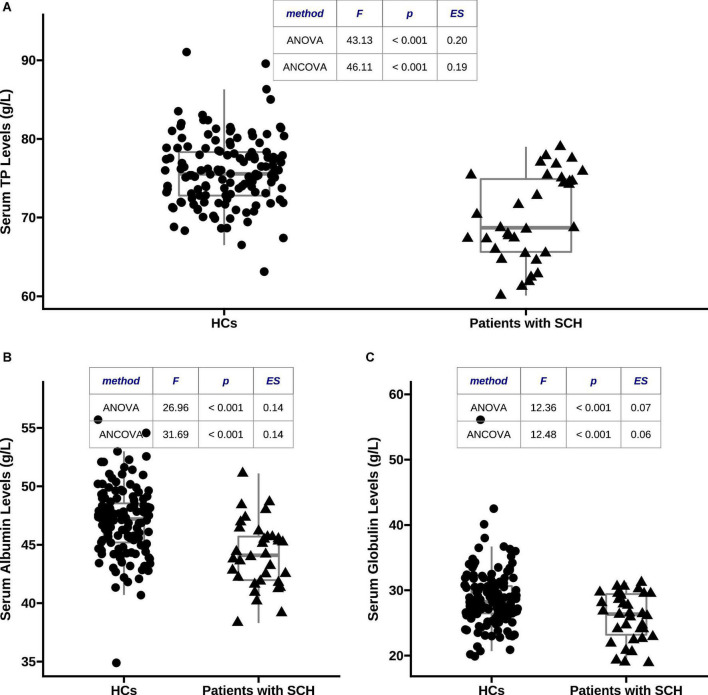
FIGURE 1.
Comparisons of serum total protein (TP), albumin, and globulin levels between patients with schizophrenia (SCH) and healthy controls (HCs). (A) Serum TP concentrations were markedly lower in patients with SCH than that in HCs after adjusting for covariates (70.01 ± 5.52 vs. 75.84 ± 4.38, F = 46.11, p < 0.001, η2 = 0.19); (B) serum albumin concentrations were markedly lower in patients with SCH than that in HCs after adjusting for covariates (44.14 ± 2.87 vs. 47.01 ± 2.90, F = 31.69, p < 0.001, η2 = 0.14); and (C) serum globulin concentrations were markedly lower in patients with SCH than that in HCs after adjusting for covariates (25.88 ± 3.67 vs. 28.83 ± 4.54, F = 12.48, p < 0.001, η2 = 0.06). TP, total protein; HCs, healthy controls; SCH, schizophrenia; ANCOVA, analysis of covariance; ANOVA, analysis of variance.

