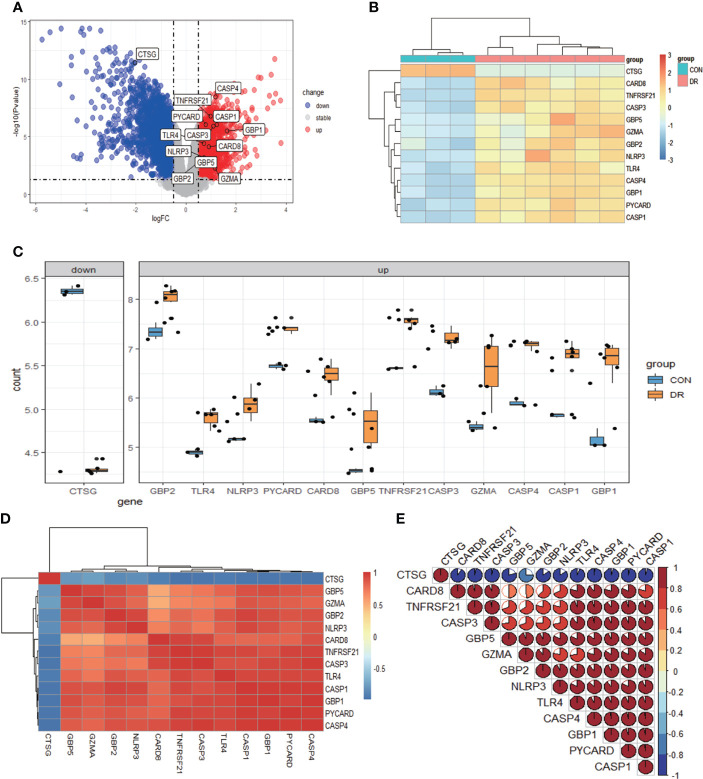
Figure 2.
Differentially expressed PRGs in PDR and normal samples. (A) Volcano plot of 3,188 differentially expressed genes in the GSE60436 dataset. It contains 1,640 significantly upregulated genes, represented by red dots, and 1,548 significantly downregulated genes, represented by blue dots, whereas gray dots represent stably expressed genes. (B) Heatmap of 13 differentially expressed PRGs in the GSE60436 dataset. It contains one significantly downregulated gene and 12 significantly upregulated genes. The green bars represent control specimens from human retinas, denoted by “CON”, and the red bars represent specimens from PDR patients, denoted by “DR”. (C) Boxplot of 13 differentially expressed PRGs in FVM tissues of PRD patients and in RNA samples from human retinas. The blue bars represent control specimens from normal individuals, denoted by “CON”, and the yellow bars represent specimens from PDR patients, denoted by “DR”. Adjusted P-value <0.05 and |log2 fold change| >0.5. (D, E) Correlation analysis of 13 differentially expressed PRGs. There was a strong correlation among the 12 upregulated genes. PRGs, pyroptosis-related genes; PDR, proliferative diabetic retinopathy; FVM, fibrovascular membrane.

