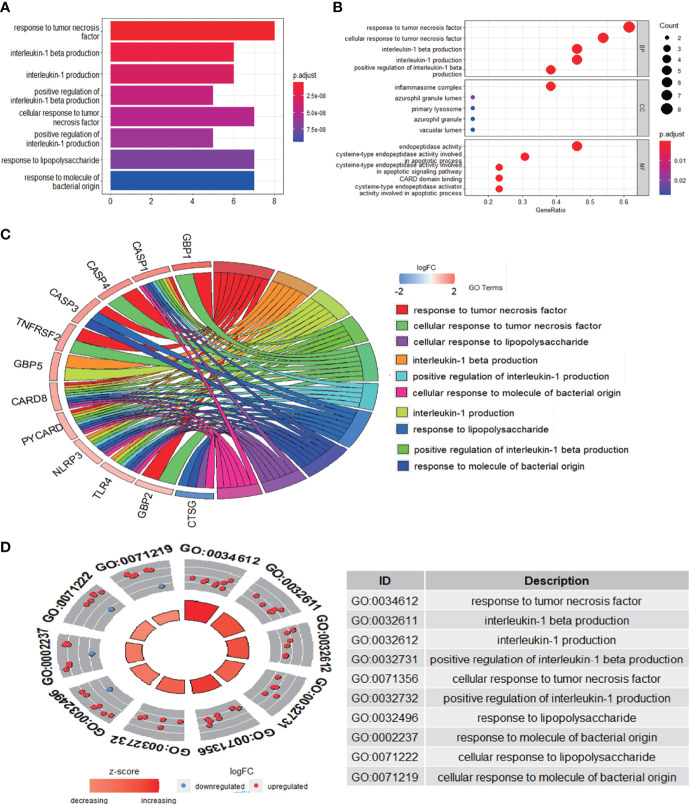
Figure 3.
GO enrichment analysis of 13 differentially expressed PRGs. (A) Bar plot of enriched GO terms. (B) Bubble plot of enriched GO terms. (C) Chordal graph of enriched GO terms. (D) Eight diagrams of enriched GO terms. It contains three aspects—BPs, CCs, and MFs—and shows the specific genes involved in each GO term. GO, Gene Ontology; PRGs, pyroptosis-related genes; BPs, biological processes; CCs, cellular components; MFs, molecular functions.

