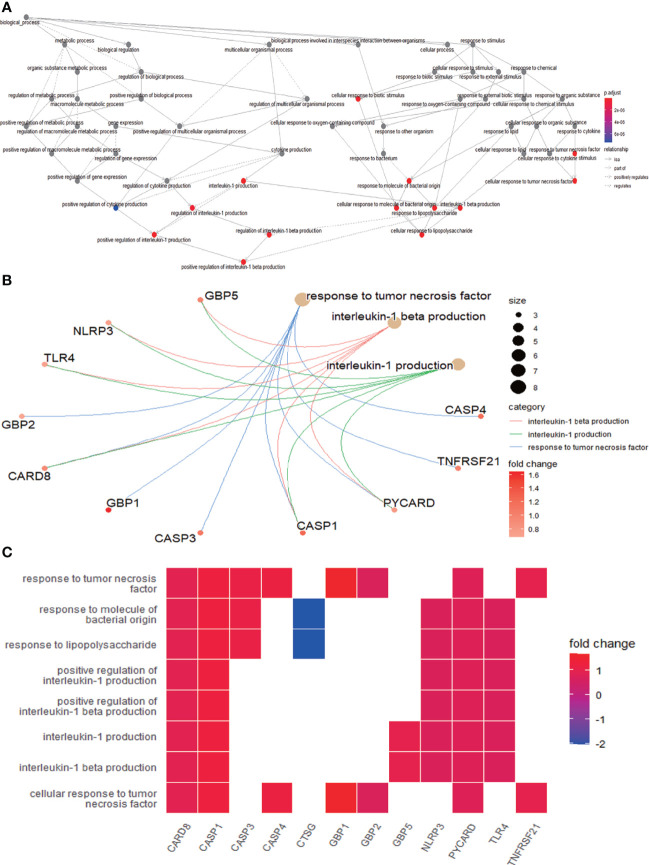
Figure 4.
Further analysis of the results obtained by GO enrichment analysis. (A) Relationship between the pathways obtained by GO enrichment analysis. (B) Common genes among the three most prominent pathways. Each path is represented by lines of different colors. (C) Heatmap-like functional classification. The enrichment relationships of differentially expressed PRGs in the eight most significant pathways are shown. GO, Gene Ontology; PRGs, pyroptosis-related genes.

