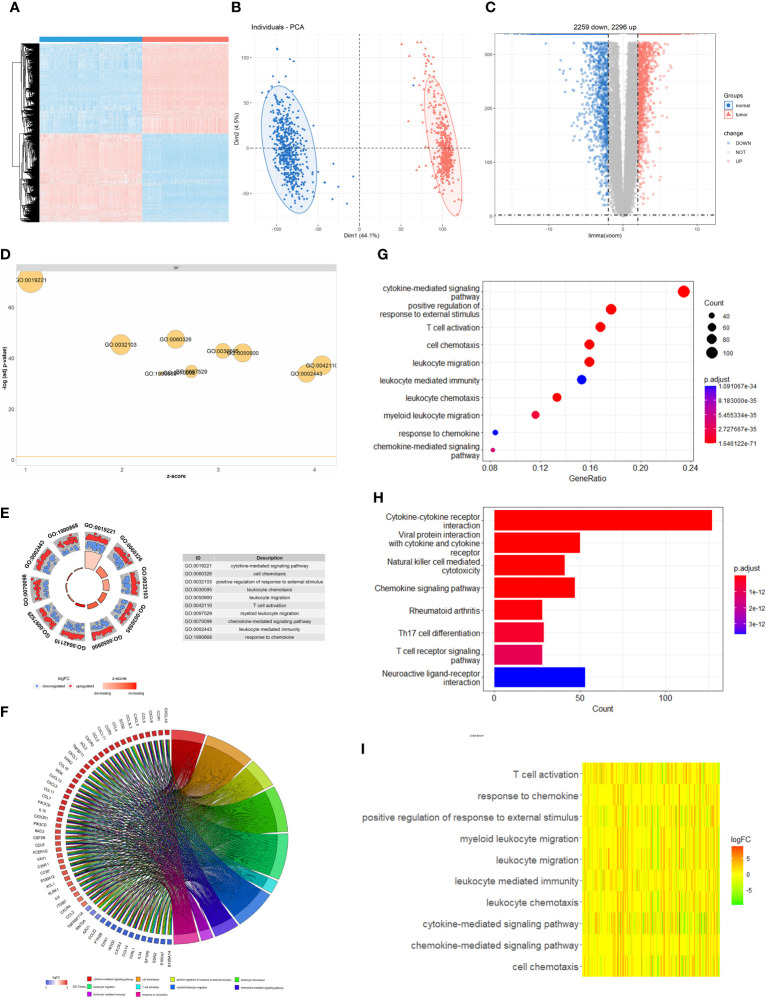
Figure 1.
Difference of genomic landscape between normal and cutaneous melanoma. (A) Hierarchical clustering of differentially expressed genes between normal and cutaneous melanoma samples. Red represents up-regulated and blue represents down-regulated. (B) PCA visualization of differentially expressed genes. (C) Volcano plot of differentially expressed genes. (D) Biological processes enrichment of gene ontology functional enrichment. (E) Molecular function enrichment of gene ontology functional enrichment. (F) Chord plot of gene ontology functional enrichment. The left half-circle indicates that the genes are sorted by |logFC| and the right half-circle indicates that the gene ontology enrichment analysis term is sorted by strong and weak variation. Red represents up-regulation and blue represents down-regulation, and color shades represent fold change. (G) Cellular component enrichment of gene ontology functional enrichment. (H) KEGG pathway enrichment analyses for differentially expressed genes. All enriched pathways were significant and the color depth represented enriched adjusted P value. (I) Heatmap of differentially expressed genes between normal and cutaneous melanoma samples. Different colors represent different interaction strength relationships.

