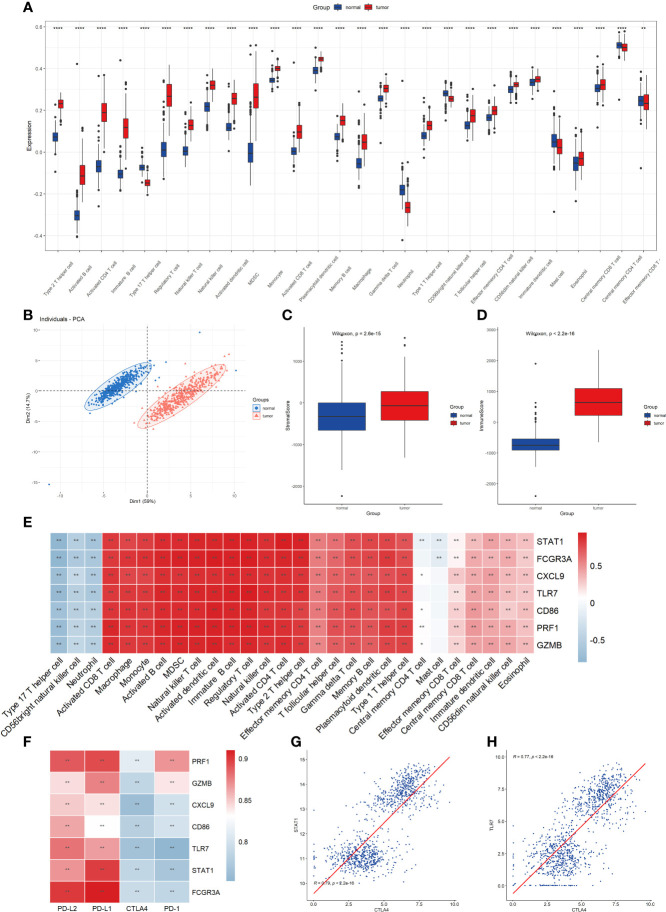
Figure 5.
Evaluation of 28 TME immune cell infiltration characterization. (A) Differences in 28 TME infiltration cells between normal skin and cutaneous melanoma (**P <0.01, ****P <0.0001). The results showed that all immune cells were significantly different between the two types of samples. (B) Principal component analysis. The results demonstrated that the two separate taxa, suggesting there existed significantly differences in the landscape of 28 TME immune cell infiltration between normal skin and cutaneous melanoma. (C) Difference in StromalScore between normal and tumor tissues using ESTIMATE algorithm. (D) Difference in ImmuneScore between normal and tumor tissues using ESTIMATE algorithm. (E) The correlation between seven key molecule and each TME infiltration cell type. The results showed a strong correlation between them, red represents positive and blue represents negative. (*P<0.05, **P <0.01) (F) The correlation between the seven key molecules and four immune checkpoint molecules. The results demonstrated a strong correlation between them. (**P <0.01) (G) The correlation between STAT1 expression and CTLA4 expression. (H) The correlation between TLR7 expression and CTLA4 expression.

