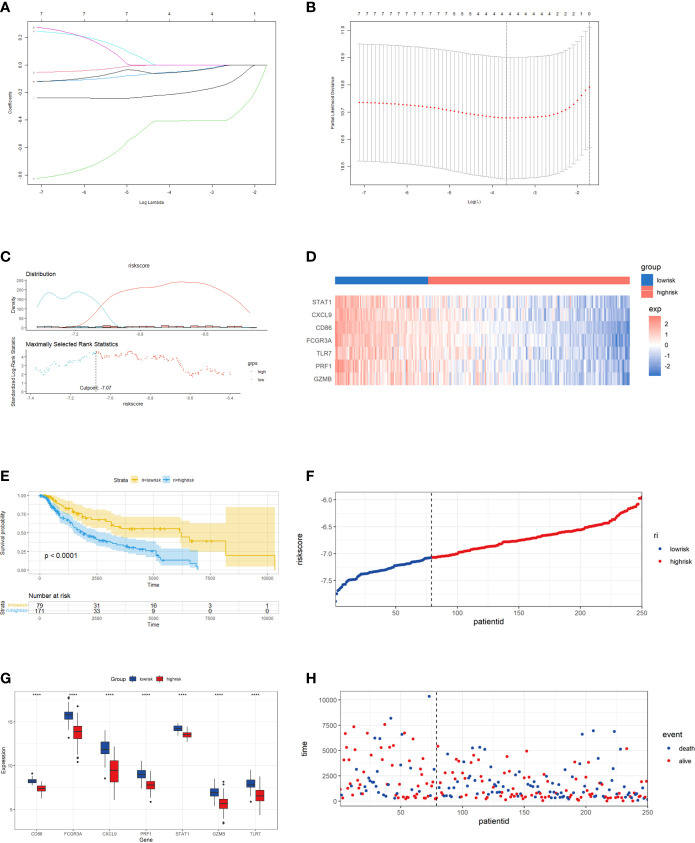
Figure 6.
Construction of riskScore signature in cutaneous melanoma. (A) Least absolute shrinkage and selection operator (LASSO) coefficient profiles of the seven key molecules. Horizontal axis represents log of independent variable λ. Vertical axis represents coefficient of independent variable. (B) Tenfold cross-validation of tuning parameters in LASSO model. (C) The optimal cut-off point to dichotomize riskScore into low and high groups was determined by MaxStat R package. The optimal cutoff point was -7.07. (D) Survival analyses for low (79 samples) and high (171 samples) riskScore groups using Kaplan-Meier curves. (E) The seven key molecules expressed in the low and high risk groups (****P <0.0001). The results showed that a strongly significant difference was exhibited between the groups. (F) The median value and distribution of the risk score. (G) The distribution of overall survival (OS) status. (H) Hierarchical clustering of seven key genes between low and high risk groups. Red represents up-regulated and blue represents down-regulated.

