
Figure 2.
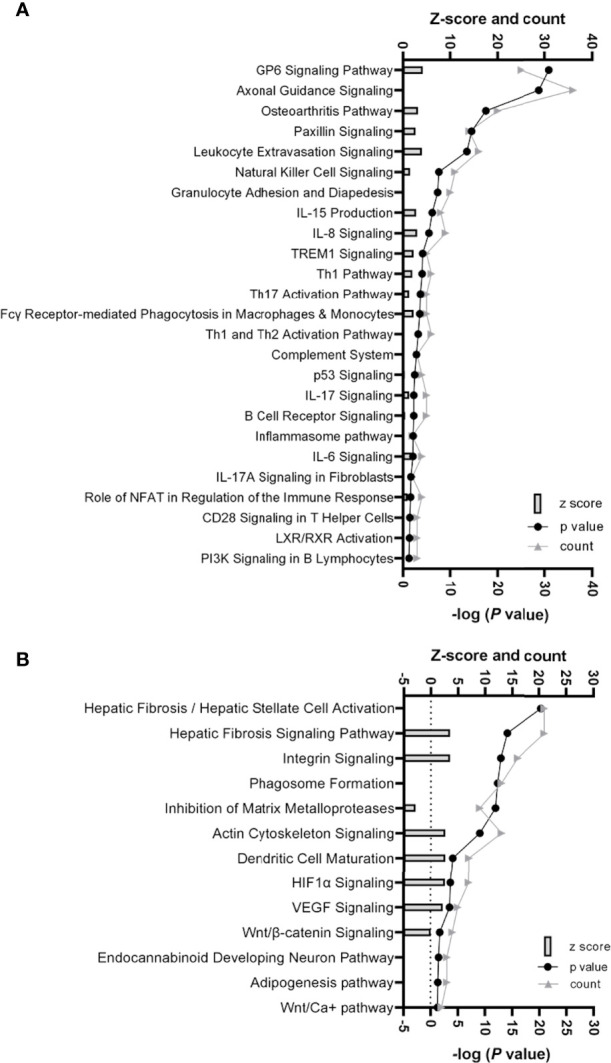
(A) Histogram of 25 significantly enriched canonical pathways involved in inflammation and immune response in scWAT in individuals living with obesity. (B) Histogram of significantly enriched canonical pathways involved in tissue remodelling and expansion in scWAT in individuals living with obesity. (A, B) The left y-axis represents the z-score (predicted score of activation/inhibition) and the number of genes counted for each of the representative canonical pathways, and the right y-axis represents -log (P-value), significance is deemed -log P> 1.3. Where z-score is not present, there was not enough evidence from current literature to determine if the altered gene expression is likely to result in activation or inhibition of a canonical pathway.