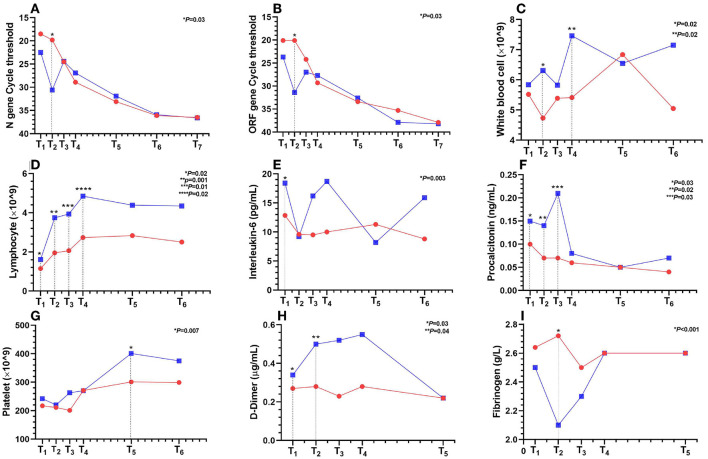
Figure 3.
Dynamic changes in laboratory results for seven time periods from T1 to T7 within 28 hospitalization days after admission. T1 to T7 represent the following: T1 ≤ 1 day; 1 < T2 ≤ 3; 3 < T3 ≤ 5; 5 < T4 ≤ 7; 7 < T5 ≤ 14; 14 < T6 ≤ 21; 21 < T7 ≤ 28 days. The red line represents the iVD group, n = 8–80 per condition. The blue line represents the sVD group, n = 4–36 per condition. Points on the line chart represent mean or median. (A) N gene cycle threshold; (B) ORF1ab gene cycle threshold; (C) white blood cells; (D) lymphocytes; (E) interleukin-6; (F) procalcitonin; (G) platelets; (H) D-dimer; (I) fibrinogen.

