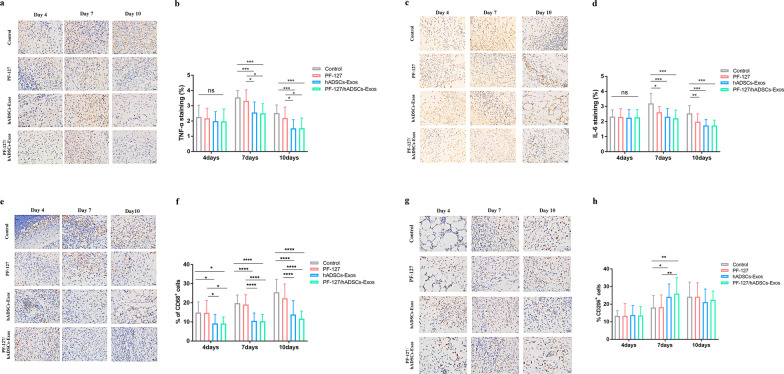
Fig. 7.
PF-127/hADSCs-Exos complex treatment inhibits inflammatory reaction. a Representative images of TNF-α immunostaining at 4, 7, and 10 days after treatment. Scale bar = 20 µm. b Quantification of TNF-α+ IHC stained tissues. c Representative images illustrating IHC results of IL-6 at 4, 7, and 10 days after surgery. Scale bar = 20 µm. d Quantification of IL-6+ IHC stained tissues. e IHC images of wound sections stained with CD68 on days 4, 7, and 10 post-wounding. Scale bar = 20 µm. f Quantification of the number of CD68 positive cells in the wound area on days 4, 7, and 10. g IHC images of wound sections stained with CD206 at days 4, 7, and 10 post-wounding. Scale bar = 20 µm. h Quantification of the number of CD206 positive cells in the wound area on days 4, 7, and 10. In b, d, and f, data are shown as mean ± SEM; n = 6 for each group. *p < 0.05, **p < 0.01, ***p < 0.001, and ****p < 0.0001 versus vehicle control group

