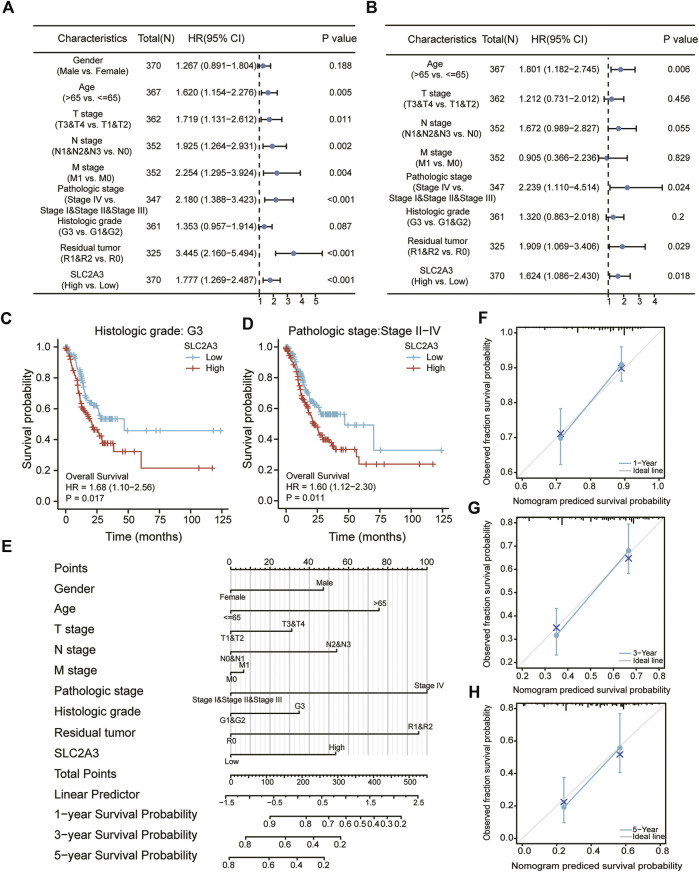
FIGURE 8.
Construction of the clinical prognosis prediction model. Univariate (A) and multivariate (B) Cox regression analyses. Survival analyses between high- and low-expression groups in the G3 (C) and stage II–IV (D) groups. Nomogram (E) and calibration curve at 1, 3, and 5 years (F–H) for prognostic prediction.

