
FIGURE 6.
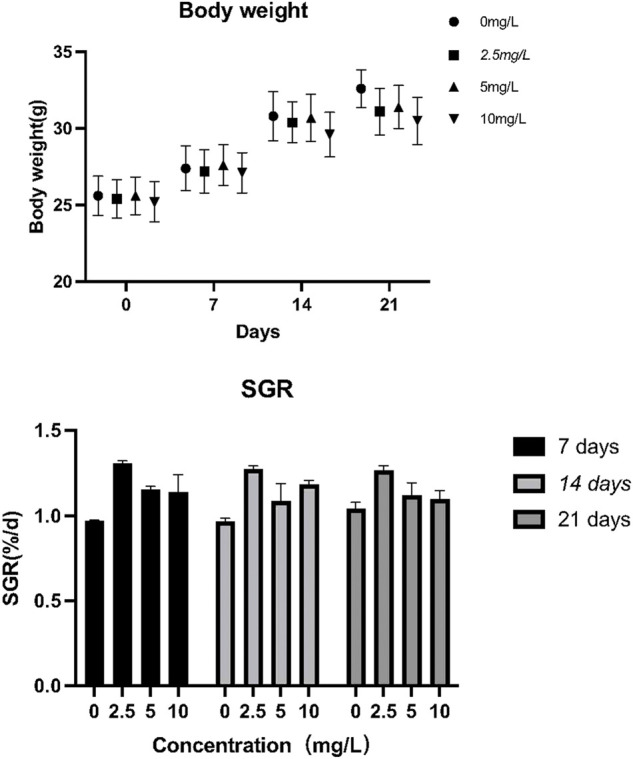
The effect of quercetin on the growth performance of Odontobutis potamophila. The bars indicate the mean weight ± SD (n = 3) of fish in the three treatment groups and the control. Statistical significance was taken as *(p < 0.05) and **(p < 0.01), compared with the control.