FIGURE 10.
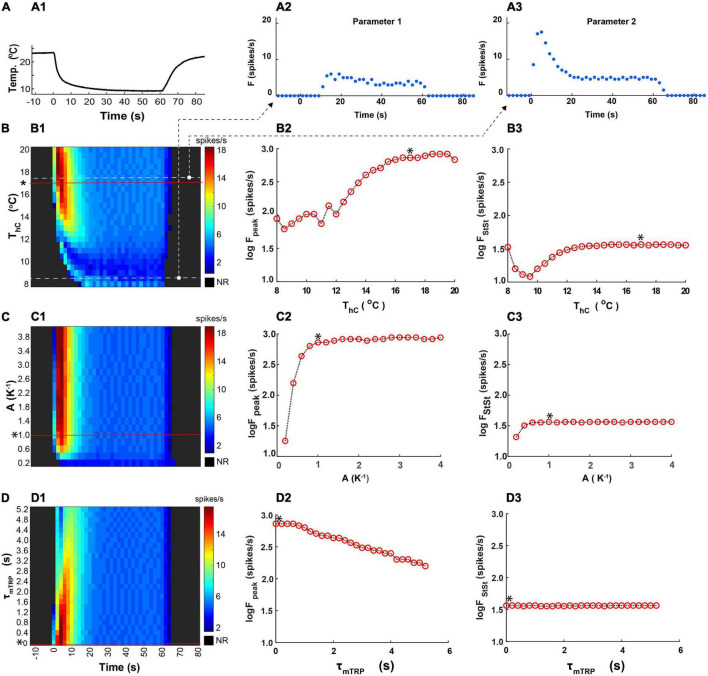
Effects of parameters determining kinetics of activation of the TRP current on the peak and the steady-state spiking rate of the CIII model’s responses to the fast temperature stimulation protocol. (A1) A representative example of the fast stimulation trace used in an experiment was applied to the CIII model. (A2,A3) Representative CIII model responses to this temperature protocol at different values of temperature of half activation: Th = 281.5K and 290.5K, respectively. For convenience, Parameter Th is represented by ThC in oC, 8.35oC, and 17.35oC, respectively. (B1–D1) Color maps code spiking responses (x axis) of the CIII model to the stimulation trace (A1) using different values of the parameter of interest (y axis) with other parameters kept at their canonical values* (a canonical parameter set in Figure 7). In all color maps, the average frequency was calculated in the 2-s bin window. (B2–D2,B3–D3) Dependences of the spiking rate peak and the steady-state spiking rate, respectively, on the parameter values: temperature of half activation, Th (ThC is in oC, B), the steepness of TRP activation, A (C), and time constant of TRP activation, τmTRP (D). NR, no response.

