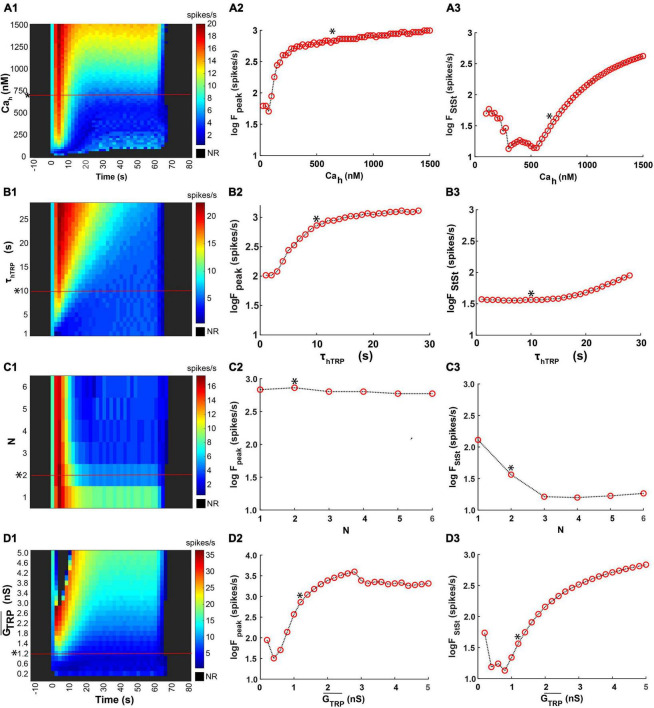
FIGURE 11.
Effects of parameters of inactivation kinetics and maximal conductance of the TRP current on the model responses. We used here the same temperature stimulation trace (Figure 10A1), the canonical set of the model parameters, measurements of the responces, and the format of the color maps as in Figure 10. (A1–D1). We investigated effects of the Ca2+ concentration of half inactivation, Cah (A1–A3), the time constant of TRP inactivation, τhTRP (B1–B3), the Hill coefficient, N (C1–C3), and the TRP current maximal conductance, , (D1–D3).

