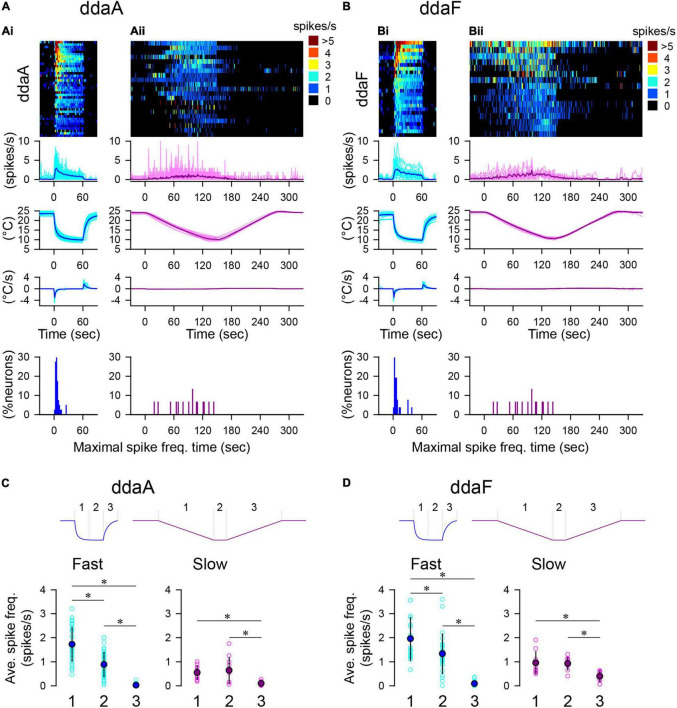
FIGURE 2.
Spiking responses of CIII neurons to two types of temperature stimulation protocols. (A,B) Spiking activities of ddaA (A) and ddaF (B) in response to the fast-stimulation protocol (10°C, Ai,Bi) and the slow-stimulation protocol (Aii,Bii). The panels show, from top to bottom, the heat map representation of the spiking rate, the plot of the averaged spiking rate against time, the temperature change, the rate of temperature change, and % histogram of the time bins (2 s), with the maximum spiking rate. In (A,B), cyan and pink traces show individual data; blue and purple traces show the mean values. N = 40 (Ai), 21 (Aii), 26 (Bi), and 15 (Bii). Time zero is set to the onset of the stimulation. (C,D) The average spiking rate in ddaA (C) and ddaF (D) during the falling phase (1), the steady phase (2), and the rising phase (3) of the fast and slow stimulation protocols drawn schematically above the graphs. Asterisks indicate significant differences (see text).

