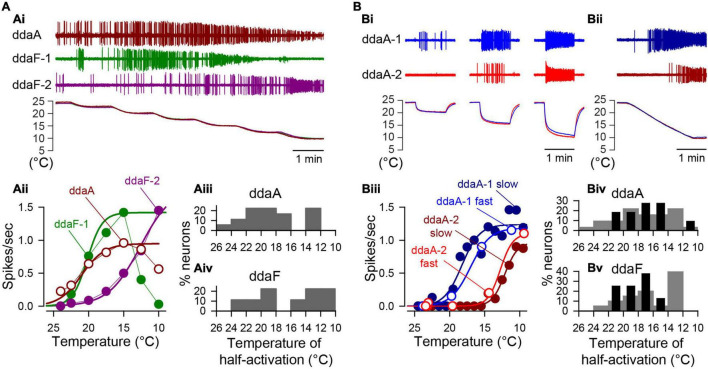
FIGURE 4.
The cold temperature sensitivity of individual CIII neurons was evaluated by curve fitting their steady-state spiking rate to the Boltzmann function of steady temperature value. (A) Examples of spiking activity of three different CIII neurons (one ddaA and two ddaFs) obtained with the step-stimulation protocol, showing different threshold temperatures. One neuron (ddaF-1) completely stopped spiking at the lowest temperature step (10°C). The activities, along with temperature recordings, are shown (Ai). The plots of the average spiking rate corresponding to each temperature (Aii), and percentile histograms of temperature of half activation for the spiking rate (Aiii,Aiv) are presented. (B) Two contrasting examples of spiking activities of two ddaA neurons in response to the fast-stimulation protocol reaching three different steady temperatures (Bi) and to the slow-stimulation protocol (Bii) are shown. In (Bi,Bii), the upper traces (blue and dark blue) and the lower traces (red and dark red) were recorded from the same set of cells, ddaA-1 and ddaA-2, respectively. The plots of spiking rates (spikes/s) against temperature (Biii), and percentile histograms of temperature of half activation for the spiking rate (Biv,Bv) were also shown. In the fast protocol (Bi), the average spike rate was measured during a 20-s window near the end of each stimulus. In the slow ramp protocol (Bii), the average spiking rate was measured for every 2°C bin (16–17 s). In (Biv,Bv) the gray bars show data by the fast-stimulation protocol, whereas the black bars by the slow-stimulation protocol.

