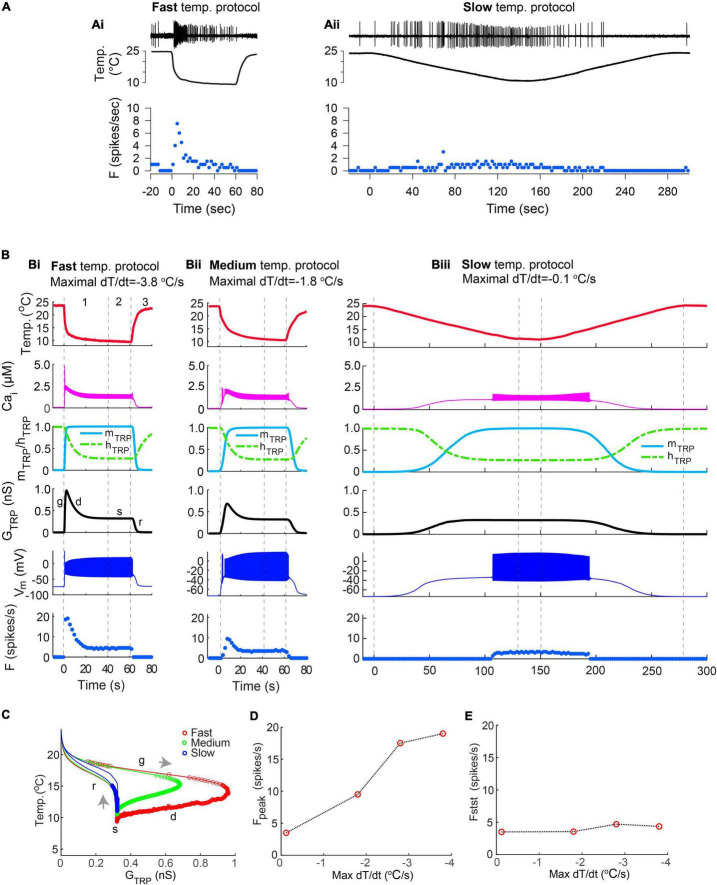
FIGURE 7.
(Ai,Aii) Examples of CIII responses to the fast-stimulation protocol (Ai) and to a slow-stimulation protocol (Aii) obtained by electrophysiological experiments. (Bi–iii) A model reproduces the diversity of responses seen in electrophysiological recordings as being due to differences in the rate of temperature changes. Fast and medium temperature changes produced a well-defined peak of the spiking rate at the beginning of the temperature stimulus (Bi,Bii), whereas slow temperature decrease did not produce any notable peak (Biii). Numbers correspond to the phases of temperature protocol: 1 – temperature declines to the noxious cold range, 2 – steady noxious cold temperature, 3– temperature rises to an ambient level. The fast, medium, and slow rates of temperature decrease were –3.8°C/s in (Bi), –1.8°C/s in (Bii), and –.12°C/s in (Biii), respectively. Letters “g,” “d,” “s,” “r” show phases of TRP conductance mentioned in Figure 6: g, growing; d, declining; s, steady, and r, returning of GTRP to its initial level. (C) The faster rate of temperature decrease, the higher peak of conductance of TRP current, GTRP. Gray arrows indicate the direction of GTRP trajectory at temperature change: temperature decrease and increase correspondingly. Color circles indicate individual spikes. (D,E) Dependence of the maximal spiking rate (D) and a steady-state frequency (E) on the maximal rate of temperature change. The bin size for frequency is 2 s. Parameters of the model were = 1.2 ns; Th = 290 K; A = 1 K–1; N = 2; Cah = 700 nM; τhTRP = 10 s; τmTRP = 0.002 s.

