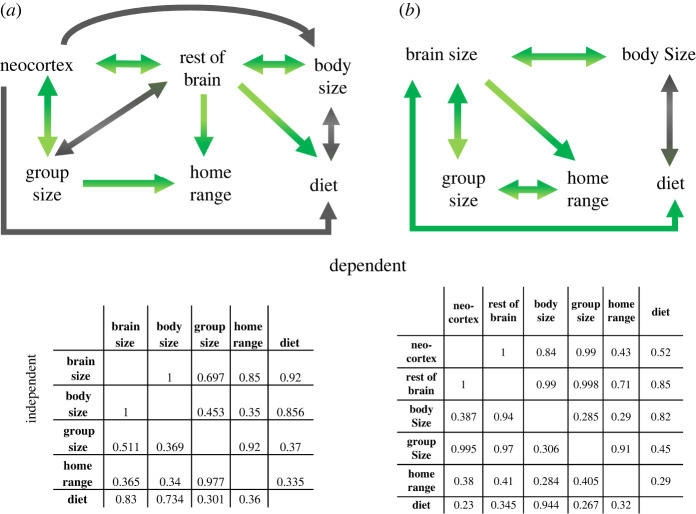
Figure 4.
Arrows highlight associations identified with ‘best fit’ models from dredging a PGLS model with each term sequentially modelled as the dependent factor for (a) endocranial volume and (b) neocortex and rest of brain. Green arrows show a significant positive association and grey arrows show a significant negative association. No arrow (or no arrow tip) indicates no relationship identified in the best fit model. The matrix shows cumulative model weight for each independent variable (left-hand row) predicting each dependent (top row). Model average results with confidence intervals are given in the electronic supplementary material. (Online version in colour.)

